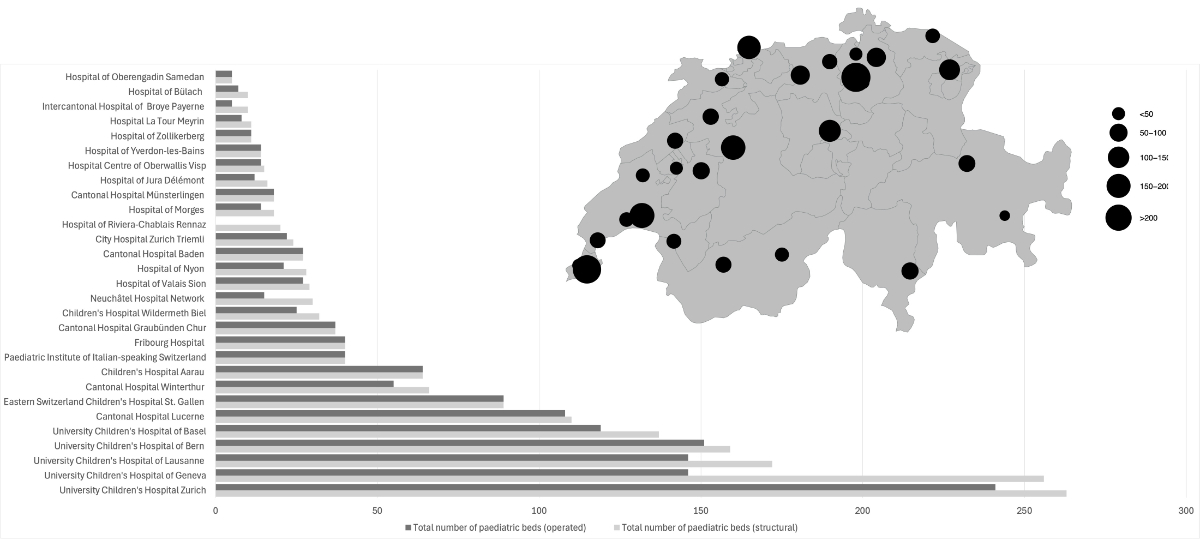
Figure 1Absolute numbers of total structural and operated hospital beds in paediatric hospitals or departments across Switzerland with structural beds depicted on a map.
DOI: https://doi.org/https://doi.org/10.57187/s.4458
Switzerland has a decentralised healthcare system, with each canton being responsible for its own healthcare services and hospital infrastructure [1, 2]. Paediatric services in Switzerland are delivered through several models: standalone children’s hospitals, which focus exclusively on paediatric care; children’s hospitals integrated within larger (university) hospitals that operate as a specialised hospital within the broader hospital network; and integrated paediatric departments within cantonal and regional hospitals. While the system ensures wide access, challenges such as staffing shortages, infectious diseases waves and regional disparities may become more important in the future. In addition, ongoing developments, including the construction of new children’s hospitals [3], aim to enhance capacity, integrate services and improve access to advanced care for children across the country.
While countries like the United States and Germany have seen significant reductions in paediatric inpatient units and hospital beds [4, 5], Switzerland lacks official statistics on paediatric inpatient capacities. The Federal Office of Public Health maintains a database of hospital statistics, including speciality clinics; however, for paediatrics, only the three standalone children’s hospitals are included [6]. This absence of complete data on paediatric hospital beds complicates efforts to efficiently manage and optimise paediatric healthcare on a national level.
We therefore aimed to fill this gap and systematically collected and analysed data on paediatric hospital beds in Switzerland, offering important insights into the current state of paediatric care infrastructure.
In this cross-sectional study, an e-mail survey was designed and distributed in January 2023 to all paediatric hospitals in Switzerland, requesting detailed information on bed availability. The distribution was coordinated by pädiatrie schweiz, which is the official professional association for paediatrics in Switzerland. Bed capacity data were self-reported by the heads of departments or chief physicians at each hospital. While no standardised bed definitions were provided in advance, we aimed to capture routine institutional reporting practices. The responses were gathered by February 2023, with follow-up inquiries completed by June 2023. The survey included data on the number of structurally available beds (SB) and operated beds (OB) across various categories, including paediatric units, paediatric intensive care units (PICU), neonatal special care units, intermediate care (IMC) units, short-stay and daycare units. “Other beds” mainly included psychiatric and psychosomatic beds. PICU bed data were self-reported, with information on official accreditation included in the analysis [7]. Neonatal special care units were classified into levels 2a, 2b and 3, with level 3 representing the highest level of care, according to the standards for neonatal care in Switzerland published and accredited by the Swiss Society of Neonatology [8].
Each response was reviewed for completeness and consistency. In cases of missing or unclear information, follow-up contact was made with the respective hospital. While no formal validation against external sources was performed, data cleaning and plausibility checks were applied to identify and resolve obvious inconsistencies. Final data were compiled in a central database and descriptive analyses and visualisation were done using R [9]. The full analysis code is available at: https://doi.org/10.5281/zenodo.15346080, archived via Zenodo. For each hospital, the total number of structurally available and operated beds was summarised by bed category (e.g. paediatric, PICU, neonatology). Aggregated totals were calculated at the national and regional levels. Proportions of non-operated beds were calculated for each bed type and reported descriptively. To provide context for the findings, population data on children aged 0–15 years from the Swiss Federal Statistical Office were used to analyse variations in bed availability across the seven major regions defined by the Swiss Federal Statistical Office [10]. The number of beds per 10,000 children in each major region was computed. For international comparison, paediatric bed data from Germany was obtained from the Federal Statistical Office and the Society for Children’s Hospitals and Paediatric Departments (GKinD e.V.).
Responses were received from all 29 paediatric hospitals or departments across 32 locations in Switzerland, including Children’s Hospital Aarau (KSA), Cantonal Hospital Baden (KSB), University Children’s Hospital of Basel (UKBB), University Children’s Hospital of Bern (Insel), Children’s Hospital Wildermeth Biel (SZB-CHB), Hospital of Bülach (SpiBue), Cantonal Hospital Graubünden Chur (KSGR), Hospital of Jura Délémont (H-IU), Fribourg Hospital (HFR), University Children’s Hospital of Geneva (HUG), University Children’s Hospital of Lausanne (CHUV), Cantonal Hospital Lucerne (LUKS), Hospital La Tour Meyrin (Latour), Hospital of Morges (EHC), Cantonal Hospital Münsterlingen (STGAG), Neuchâtel Hospital Network (RHNe), Hospital of Nyon (GHOL), Intercantonal Hospital of Broye Payerne (HIB), Hospital of Riviera-Chablais Rennaz (HRCR), Hospital of Oberengadin Samedan (SpO), Hospital of Valais Sion (HVS), Eastern Switzerland Children’s Hospital St Gallen (KispiSG), Hospital Centre of Oberwallis Visp (SOV), Cantonal Hospital Winterthur (KSW), Hospital of Yverdon-les-Bains (EHNV), Hospital of Zollikerberg (SpZo), City Hospital Zurich Triemli (STZ), University Children’s Hospital Zurich (Kispi). In Ticino, the four locations (Bellinzona, Lugano, Mendrisio and Locarno) of the Paediatric Institute of Italian-speaking Switzerland (EOC) were reported as a single centre. The survey identified a total of 1751 beds in paediatric hospitals or departments across the country, of which 1481 (85%) were operated at the time of data collection. The majority of the beds is concentrated in larger children’s hospitals, with the highest numbers of structural and operated beds, in Kispi (SB: 263, OB: 241), followed by HUG (SB: 256, OB: 146), CHUV (SB: 172, OB: 148), Insel (SB: 159, OB: 151), UKBB (SB: 137, OB: 119) and LUKS (SB: 110, OB: 108). For further details, see figure 1.
Figure 1Absolute numbers of total structural and operated hospital beds in paediatric hospitals or departments across Switzerland with structural beds depicted on a map.
Across Switzerland, eight hospitals have an official PICU accreditation [7]. At the time of data collection, these hospitals reported a total of 112 PICU beds, with 90 beds (80%) being operated. More than ten structural PICU beds were reported from Kispi (SB: 25, OB: 21), CHUV (SB: 16, OB: 12), UKBB (SB: 16, OB: 12), HUG (SB: 13, OB: 7), Insel (SB: 12, OB: 10) and LUKS (SB: 11, OB: 9). For further details, see figure 2. Additional beds in this category were reported at KSA (SB: 6, OB: 6), STGAG (SB: 2, OB: 2) and KSW (SB: 6, OB: 5).
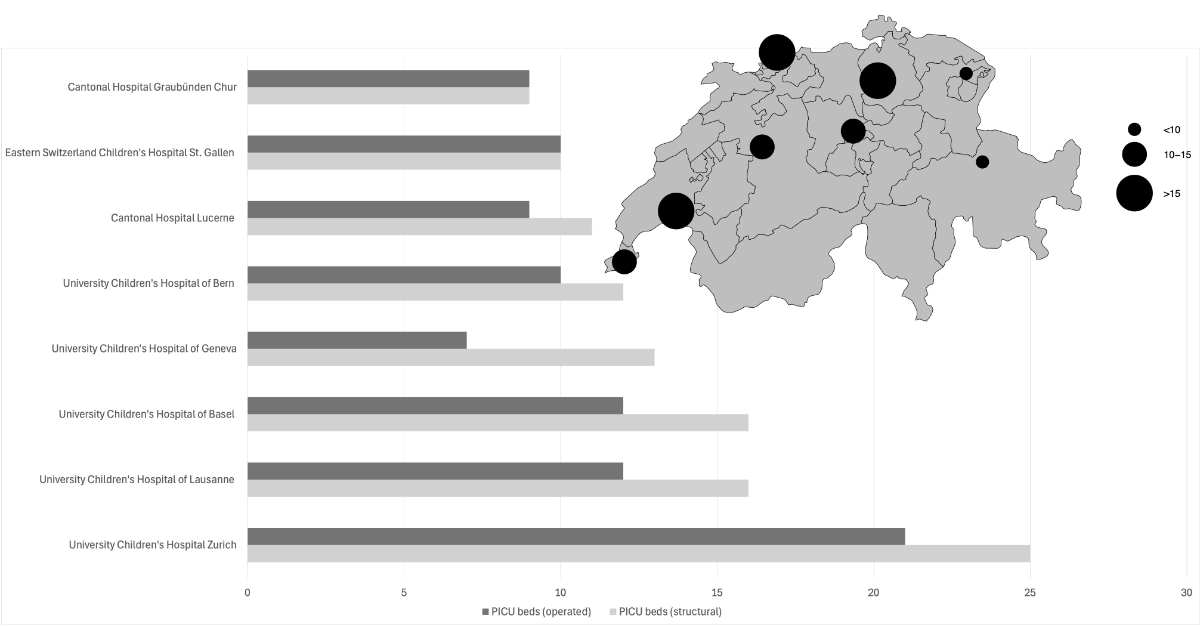
Figure 2Absolute numbers of structural and operated paediatric intensive care unit (PICU) beds across Switzerland with structural beds depicted on a map. Cantonal Hospital Graubünden Chur, Eastern Switzerland Children’s Hospital St Gallen, Cantonal Hospital Lucerne, University Children’s Hospital of Basel: includes neonatal/NICU beds; University Children’s Hospital of Basel: distribution of PICU beds can be regulated by demand. Children’s Hospital Aarau, Cantonal Hospital Münsterlingen and Cantonal Hospital Winterthur are not shown in this figure.
A total of 339 neonatology beds were reported in the following categories.
A total of 35 level 2a neonatology beds were available across EHC, EHNV, GHOL, HIB, H-IU, HRCR and Latour. A total of 97 level 2b neonatology beds are available across EOC, HFR, HVS, KSB, KSW, SpZo, RHNe, SpiBue, STZ, STGAG and SZB-CHB. A total of 207 level 3 neonatology beds were available across CHUV, HUG, Insel, Kispi, KispiSG, KSA, LUKS and UKBB.
On average, 14% of the neonatology beds were not operated, with level 2a units experiencing the highest rate at the time of reporting. For further details, see figure 3.
Notably, some hospitals (e.g. KSGR) care for neonates in their PICU wards, which were not included in this section.
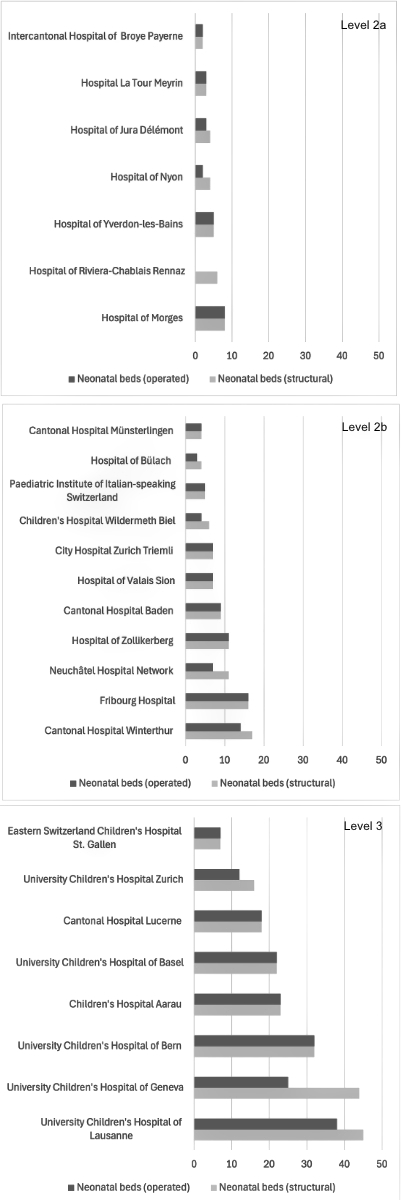
Figure 3Absolute numbers of structural and operated neonatology beds across Switzerland. University Children’s Hospital of Basel: Four of the neonatal beds are rooming-in beds; University Children’s Hospital of Bern: 10 beds are neonatal intensive care unit (ICU) beds, 22 intermediate care (IMC); Children’s Hospital Wildermeth Biel: 2 IMC beds; Hospital of Jura Délémont: one fully equipped kangaroo-room; Hospital of Zollikerberg: 6 of the beds are IMC beds; Eastern Switzerland Children’s Hospital St Gallen: additional 20 neonatology beds were reported. Only level 3 beds are shown in this figure.
A total of 127 IMC beds were reported, of which 17% were not operated. Over ten structural IMC beds were recorded at KispiSG (SB: 27, OB: 27), Kispi (SB: 16, OB: 12), CHUV (SB: 12, OB: 10), LUKS (SB: 11, OB: 11) and KSW (SB: 11, OB: 9). In many instances, IMC beds also include neonatology beds (see appendix figure S1).
The survey identified 581 paediatric beds with 18% not being operated, 274 surgical beds with 17% not being operated, 44 short-stay beds with 17% not being operated, 168 daycare beds with 1% not being operated, and 200 other beds with 25% not being operated (see appendix figures S2–S6).
Overall, the total of 1751 beds corresponds to 13 beds per 10,000 children in Switzerland. The Lake Geneva region has the highest bed-to-child ratio, with 20 beds per 10,000 children. In contrast, Eastern Switzerland, Ticino, Espace Mittelland and Central Switzerland have lower ratios. For further details, see table 1.
Table 1Total structural beds per region.
| Hospital | Region | Total structural beds per hospital | Number of children (0-15 years) per region | Total beds per region | Total beds per 10k children |
| University Children’s Hospital of Bern | Midland Region | 159 | 304,918 | 277 | 9 |
| Children’s Hospital Wildermeth Biel | 32 | ||||
| Hospital of Jura Délémont | 16 | ||||
| Fribourg Hospital | 40 | ||||
| Neuchâtel Hospital Network | 30 | ||||
| University Children’s Hospital of Geneva | Lake Geneva Region | 256 | 284,185 | 573 | 20 |
| University Children’s Hospital of Lausanne | 172 | ||||
| Hospital La Tour Meyrin | 11 | ||||
| Hospital of Morges | 18 | ||||
| Hospital of Nyon | 28 | ||||
| Intercantonal Hospital of Broye Payerne | 10 | ||||
| Hospital of Riviera-Chablais Rennaz | 20 | ||||
| Hospital of Valais Sion | 29 | ||||
| Hospital Centre of Oberwallis Visp | 15 | ||||
| Hospital of Yverdon-les-Bains | 14 | ||||
| Children’s Hospital Aarau | Northwestern Switzerland | 64 | 191,083 | 228 | 12 |
| Cantonal Hospital Baden | 27 | ||||
| University Children’s Hospital of Basel | 137 | ||||
| Cantonal Hospital Graubünden Chur | Eastern Switzerland | 37 | 165,851 | 149 | 9 |
| Cantonal Hospital Münsterlingen | 18 | ||||
| Hospital of Oberengadin Samedan | 5 | ||||
| Eastern Switzerland Children’s Hospital St Gallen | 89 | ||||
| Paediatric Institute of Italian-speaking Switzerland | Ticino | 40 | 48,504 | 40 | 8 |
| Cantonal Hospital Lucerne | Central Switzerland | 110 | 134,739 | 110 | 8 |
| Hospital of Bülach | Zurich | 10 | 255,334 | 390 | 15 |
| Cantonal Hospital Winterthur | 66 | ||||
| Hospital of Zollikerberg | 11 | ||||
| City Hospital Zurich Triemli | 24 | ||||
| University Children’s Hospital Zurich | 263 |
Germany submitted a summary report, listing a total of 18,696 beds, which corresponds to 13 beds per 10,000 children. Of these, 1718 are PICU beds, with 43% not being operated, and 2068 are neonatology beds, with 30% not being operated at the time of data collection.
This study is the first systematic effort to gather and analyse data on bed capacity in Swiss paediatric hospitals or paediatric departments. The study shows that there were 1751 self-declared beds of which 85% were being operated in early 2023. The data also reveals variability in capacity across different care types. PICU beds, comprising 112 beds at an 80% rate of operated beds, are critical yet fewer in number. Patients requiring these beds have complex and life-threatening conditions resulting in high staffing requirements and turnover rates. Access to PICU beds may directly influence outcomes, particularly in emergency situations where rapid admission can reduce mortality and morbidity rates among critically ill children. Neonatology beds, of which there are 339 with 86% in use, are similarly essential for providing care to preterm and critically ill newborns. The fact that these specialised units are not operated at full capacity is concerning, as it may limit access to critical care for infants and children with severe medical conditions.
The non-operated beds are an indication that paediatric departments and hospitals are no longer able to fully operate structural beds or that these beds are not required. While the bare numbers of available beds alone cannot answer why some beds are not operated, this could be due to several reasons. One important factor is the ongoing healthcare staff shortage in Switzerland, which has been a growing concern in recent years. According to a recent report by a company specialised in accounting, consulting and advisory services, the Swiss healthcare system is heading towards a shortage of nearly 40,000 nursing staff and around 5500 doctors by the year 2040 [11]. This shortage is exacerbated by inadequate funding for paediatrics, which leads to difficulties in staffing as well as attracting and retaining paediatric specialists. Additionally, staff working in specialised care settings, such as PICU and neonatal units, require specific training and expertise, further compounding staffing challenges. While the number of paediatric patients requiring inpatient care experiences significant seasonal fluctuations, a certain level of standby capacity must be maintained, as most hospital admissions in paediatrics are unplanned (e.g. through the emergency department or deliveries). Addressing this shortage and the inadequate funding in paediatrics will be essential to ensure the high quality and standards of paediatric care in Switzerland in the future. Another important factor why paediatric structural beds were not operated could be the growing trend in paediatric care towards shorter inpatient stays, outpatient treatment, home-based care for certain conditions and the flexible adaptation of the operated beds to meet specific needs. As a result, the number of paediatric beds may decrease, without necessarily compromising the quality of care.
The survey shows a concentration of paediatric beds in larger hospitals, located in Zurich, Geneva, Lausanne, Bern, Basel and Lucerne. In addition to this centralising effect, our study found regional differences in bed availability; the Lake Geneva region has the highest bed-to-child ratio, compared to substantially lower ratios in other regions such as Central Switzerland, Eastern Switzerland and Ticino. These calculations may however not fully reflect real-life availability, as children and families often seek care beyond their cantonal and regional hospitals. Factors such as specialised expertise, the availability of PICUs and other reasons may lead families to seek treatment in other cantons, regions or even internationally. In addition, tourism can influence the paediatric bed situation in some regions, as the influx of visitors may increase demand for healthcare services. Other reasons could contribute to these regional differences, including hospitalisations and treatment of children in adult hospitals. As a result, patient distribution may differ from simple geographic allocations. However, these discrepancies suggest that access to paediatric care can vary significantly depending on geographic location, which could impact the quality and timeliness of care for children in different areas in Switzerland. It is therefore crucial to recognise that demand for paediatric beds is shaped by multiple factors beyond population size alone. Policy decisions regarding paediatric bed capacities should avoid a one-size-fits-all approach and instead consider the full context of regional healthcare demands and disparities in access to care.
Data for international comparisons are limited. When comparing the Swiss data with Germany, both countries show similarities in paediatric bed availability, although Germany has a higher proportion of non-operated beds. A longitudinal analysis in Germany shows a steady decline in paediatric beds, which decreased by one-third between 1991 and 2022, despite an annual increase of over 100,000 paediatric cases [5]. In the United States (US), where hospital infrastructure is extensively studied, a similar trend of declining paediatric inpatient capacity has been observed. Between 2008 and 2018, there was a 19% annual decrease in paediatric units and a 12% annual decrease in paediatric beds, with rural areas being most affected. Despite these reductions, the number of PICU beds is increasing, particularly in large paediatric hospitals [4]. Moreover, the proportion of hospitalised patients requiring intensive care and those with complex chronic conditions is rising in the US [4, 12]. Concurrently, there has been a decline in overall admissions, an increase in short-stay admissions for observation and a reduction in the average length of stay in children’s hospitals [13, 14]. It is important to consider that many countries, including the US, have dedicated children’s transport systems, which allow for more flexible reallocation of beds and resources, especially in times of need [15]. This system can mitigate the impact of bed shortages in one location by enabling patient transfers to other facilities.
A key strength of this study is that it is the first of its kind to provide an estimate and analysis differentiating between structural and operated beds of all paediatric hospitals and departments in Switzerland. The distinction between structural and operated beds is critical, as structural bed numbers alone do not offer an accurate representation of a hospital’s true capacity to provide care. Operated beds – those actively staffed and available for use – are a more precise indicator of the resources that are accessible to patients.
However, our study is also subject to limitations. First, our analysis focused on the metric of paediatric hospital beds. Bed availability alone does not provide a complete picture of the system’s capacity to care for paediatric patients. The definition of a “bed” can vary depending on the context (paediatric, IMC, daycare, etc) and bed use may be adapted to specific needs, such as IMC beds repurposed for neonates. Second, bed category definitions differ between hospitals and there is no universal definition of types of beds in paediatric hospitals and departments in Switzerland. For instance, some hospitals make no distinction between PICU and neonatal intensive care unit (NICU) wards, paediatric and surgical beds and include psychiatric beds. Third, our study employed a cross-sectional design, which limits its ability to account for the significant seasonal variations in bed capacity that hospitals may plan to accommodate seasonal fluctuations in admissions. These fluctuations are driven by factors such as respiratory illnesses and viral outbreaks.
While a significant portion of paediatrics beds in Switzerland are operated, the existence of many non-operated beds has been noted. Ensuring equitable access to paediatric care across different regions is essential and our findings indicate disparities. The study underscores the critical need for comprehensive data collection on paediatric hospital capacity. This includes national definitions of bed types and the documentation of the number of children treated in adult facilities. For the future planning of paediatric care in Switzerland, a cantonal approach is likely no longer adequate. Instead, regional structures should be developed and implemented to create an optimal healthcare system for children. Furthermore, given the fluctuating and evolving nature of paediatric healthcare needs, it is essential to track paediatric hospital capacity over time enabling better resource allocation and planning.
The underlying data are not publicly available, as no data-sharing agreement was in place at the time of collection. The data were provided by participating hospitals under confidentiality terms that do not allow for public redistribution. However, all aggregated data used in the analysis are included in the manuscript to ensure transparency. The analytical code was written in R and is publicly accessible at https://doi.org/10.5281/zenodo.15346080.
We thank all Swiss paediatric hospitals for providing detailed data on hospital beds, with special thanks to Amelie Paquette, Andres Pascual, Mascha Rochat, Kabangu Kayembakays, Cathrin Buechi and Silke Grupe. We thank the office of pädiatrie Schweiz for support in the distribution of the survey and data collection. We also thank the Swiss Federal Statistical Office for supplying regional population data, and the German Society for Children’s Hospitals and Paediatric Departments (GKinD e.V.) for sharing hospital bed data.
Author contributions: NR initiated and designed the study and oversaw the distribution of the survey. JW analysed the data and drafted the initial manuscript, which was subsequently revised by NR. CB, VB, SF, MG, PG, MVK, JL, VM, KPB, GFL, RPL, BR, RKS, GDS, FS, MT, RVV, AZ, PZ, UZ and HK provided data, critically reviewed the manuscript and contributed to its final version. All authors approved the final manuscript.
This study did not receive any funding.
All authors have completed and submitted the International Committee of Medical Journal Editors form for disclosure of potential conflicts of interest. No potential conflict of interest related to the content of this manuscript was disclosed.
1. Frei A, Hunsche E. The Swiss health care system. Eur J Health Econ. 2001;2:76–8.
2. Sturny I. The Swiss health care system. International Profiles of Health Care Systems; 2020. p. 191. Available from https://www.commonwealthfund.org/sites/default/files/2020-12/International_Profiles_of_Health_Care_Systems_Dec2020.pdf
3. Zuhause im Kinderspital [cited 31 October 2024]. Saez. 2024. Available from: https://saez.swisshealthweb.ch/de/article/doi/saez.2024.1360004207/
4. Cushing AM, Bucholz EM, Chien AT, Rauch DA, Michelson KA. Availability of pediatric inpatient services in the United States. Pediatrics. 2021 Jul;148(1):e2020041723.
5. Finanzierung Kinderkliniken. Deutsche Gesellschaft für Kinder- und Jugendmedizin e.V. [cited 11 September 2024]. Available from: https://www.dgkj.de/unsere-arbeit/politik/faqs-finanzierung-kinderkliniken
6. BAG. Spital suchen. [cited 31 October 2024]. Available from https://www.bag.admin.ch/de/spital-suchen
7. Swiss Society of Neonatology. Accredited pediatric ICUs (6–12 months). [cited 13 November 2024]. Available from: https://www.neonet.ch/unit-accreditation/accredited-pediatric-icus
8. Swiss Society of Neonatology. Standards for Levels of Neonatal Care in Switzerland. 2019. [cited 31 October 2024]. Available from: https://www.neonet.ch/application/files/7715/6880/5956/Level_Standards_2019-03-14.pdf
9. R Core Team. R A language and environment for statistical computing. Vienna, Austria: R Foundation for Statistical Computing; 2020.
10. Schweizerische Eidgenossenschaft. Analyseregionen. Bundesamt für Statistik. Available from: https://www.bfs.admin.ch/bfs/de/home/statistiken/querschnittsthemen/raeumliche-analysen/raeumliche-gliederungen/analyseregionen.html
11. PricewaterhouseCoopers. Neue Spitalstudie: Inflation, Fachkräftemangel, starre Tarife – tückische Kombination für Schweizer Spitäler. [cited 31 October 2024]. PwC. 2022. Available from : https://www.pwc.ch/de/presse/inflation-fachkraeftemangel-starre-tarife-tueckische-kombination-fuer-schweizer-spitaeler.html
12. Brown CM, Williams DJ, Hall M, Freundlich KL, Johnson DP, Lind C, et al. Trends in length of stay and readmissions in children’s hospitals. Hosp Pediatr. 2021 Jun;11(6):554–62.
13. Macy ML, Hall M, Shah SS, Harding JP, Del Beccaro MA, Hain PD, et al. Pediatric observation status: are we overlooking a growing population in children’s hospitals? J Hosp Med. 2012 Sep;7(7):530–6.
14. Bucholz EM, Toomey SL, Schuster MA. Trends in pediatric hospitalizations and readmissions: 2010–2016. Pediatrics. 2019 Feb;143(2):e20181958.
15. Tanem J, Triscari D, Chan M, Meyer MT. Workforce survey of pediatric interfacility transport systems in the United States. Pediatr Emerg Care. 2016 Jun;32(6):364–70.
The appendix is available in the pdf version of the article at https://doi.org/10.57187/s.4458.