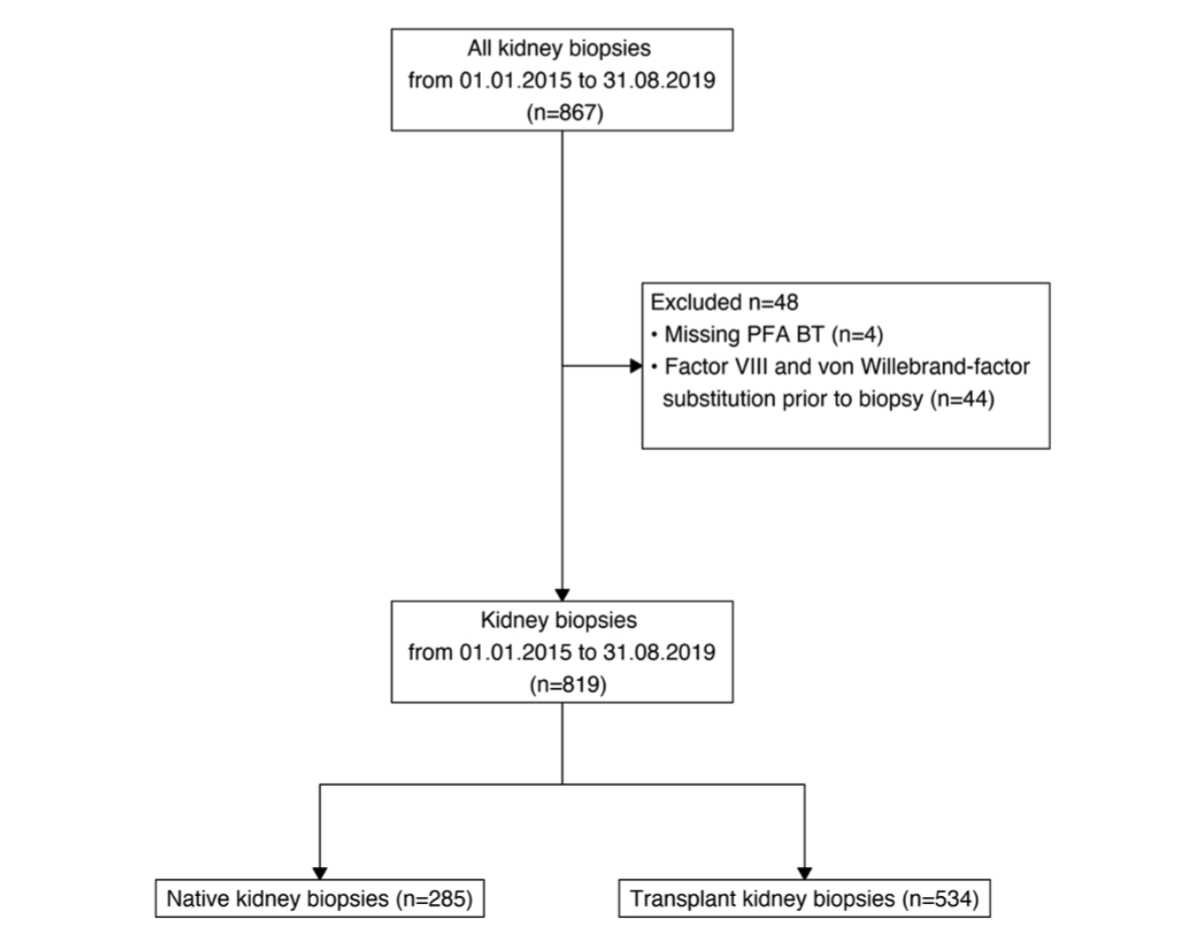
Figure 1Composition of the study cohort. PFA BT: platelet function analyser bleeding time.
DOI: https://doi.org/https://doi.org/10.57187/s.4409
Renal biopsies provide important and decisive information for diagnosis and therapy. Ultrasound-guided renal biopsies were introduced to clinical practice in the 1990s. They are generally considered safe but are sometimes associated with risks such as bleeding complications, haematoma, and pain [1–14]. The risk profile differs between native and transplant kidney biopsies [15]. Typically, the risk of patients developing minor complications, such as bleeding complications, haematoma, or pain, is low. Major complications, such as nephrectomy or death, are extremely rare. Bleeding complications are the primary adverse event after this procedure [16]. Numerous studies have investigated the frequency, type, and risk factors of bleeding complications after native and transplant kidney biopsies [16–17].
To minimise the risk of bleeding complications, patients typically undergo blood clotting screening tests before undergoing biopsy, one of which is the platelet factor analyser (PFA). Unfortunately, little is known about its association with bleeding complications after renal biopsies [18].
This observational single-centre study aimed to identify risk factors for bleeding after native or transplant kidney biopsy. The associations between different parameters and bleeding complications were analysed. Specifically, we examined the association between platelet function analyser bleeding time (PFA BT), other coagulation parameters, and renal function (eGFR) with bleeding complications.
The University Hospital Basel is a tertiary care hospital responsible for medical care in the northwest of Switzerland. The Clinic for Transplantation, Immunology, and Nephrology provides nephrology services for the entire hospital, including the management of acute kidney injury, acute renal replacement therapy in intensive care units, and chronic renal replacement therapies in the area. It is also one of the leading kidney transplant centres in the country. 70–90 kidney transplantations are performed annually, approximately 40% of which are from living kidney donors. The clinic oversees all ultrasound-guided kidney biopsies.
All patients who underwent a percutaneous and ultrasound-guided renal biopsy at the University Hospital Basel between January 2015 and August 2019 were included. Patients who received factor VIII and von Willebrand-factor substitution before the biopsy were excluded. The patients were divided into two groups: biopsies of native kidneys and biopsies of transplant kidneys. This study was approved by the ethical commission Nordwest und Zentralschweiz EKNZ (BASEC-ID: 2019-02127). All patients provided written consent to the biopsy. This study adhered to the STROBE reporting guidelines [19] and was conducted in accordance with the Declaration of Helsinki.
Before the biopsy, all patients underwent a laboratory screening test, including the PFA BT, a test for primary haemostasis [18]. The platelet function analyser draws a patient’s blood sample through a disposable test cartridge with a microscopic aperture in a biologically active membrane. This membrane is coated with either epinephrine and collagen or ADP and collagen. The closure time (in seconds) for blood to close the aperture is measured. PFA EPI (epinephrine and collagen) was measured in all patients, and if prolonged (>160 seconds), PFA ADP (ADP and collagen) was measured. PFA ADP values below 120 seconds were considered normal. Alongside PFA BT, haemoglobin count, INR, thrombocyte count, serum creatinine, and eGFR (calculated using the 2012 CKD EPI formula) [20] were collected. All standard values adhered to the specifications of the University Hospital Basel. Demographic and medical data, including sex, age at the biopsy, outpatient/inpatient status, biopsy date, and – in the transplant group – biopsy type (surveillance or diagnostic) and time post-transplantation, were extracted from the hospital clinic information system and anonymously analysed in a separate database. Internal data validation was performed, and missing values were added if possible.
All biopsies were with ultrasound guidance under sterile conditions with a sterile ultrasound transducer and a 16-gauge needle inserted through the transducer. For native kidney biopsies, patients were in a prone position, and for transplant kidney biopsies, they were in a supine position. Local anaesthesia with lidocaine was applied, and a scalpel was used to make a 2–3 mm incision. At least two specimens were taken. Patients remained in a supine position for four hours and were discharged if they were symptom-free and no macrohaematuria was observed.
The primary outcome was significant bleeding, defined as a relevant haemoglobin decrease (>10 g/l within 48 hours after biopsy) or the need for transfusion after bleeding (at the discretion of the treating physician) clearly associated with the biopsy. In addition, secondary outcomes included the need for hospitalisation due to biopsy within one week of the procedure and treatment in the ICU within 72 hours as a consequence of the biopsy. Macrohaematuria, bladder tamponade biopsy abortion, vomiting, and vasovagal reaction were categorised as other complications.
Analyses were performed using JMP® version 16.1; SAS Institute Inc., Cary, NC, 1989–2023; SPSS version 28.0.1.1; and R (R Core Team 2019. R: A language and environment for statistical computing. R Foundation for Statistical Computing, Vienna, Austria, URL: https://www.R-project.org/). All hypothesis testing was two-tailed, and an alpha level of <0.05 was considered statistically significant. Discrete variables are expressed as counts (percentages). Pearson Chi2 or Fisher Exact tests for small samples were used to compare groups. Continuous variables are expressed as medians and interquartile ranges [IQRs], and the Mann-Whitney U test was used to compare groups. Considering the low event rate, odds ratios were calculated as a measure of effect with corresponding 95% confidence intervals. Furthermore, we built a logistic regression model including possible risk factors for bleeding. Because of the limited number of bleeding complications and the resulting low events-per-variable ratio, a multivariable model with three degrees of freedom was selected. To relax the linearity assumption, eGFR was fitted using restricted cubic splines with 3 knots at the 0.1, 0.5, and 0.9 quantiles. Because of the low number of events, multivariable analyses were not conducted in the transplant and native kidney groups. However, the analysis was stratified by the median eGFR of all patients. No imputation was used to address missing values. To assess the correlation between renal function and PFA BT, we calculated a combined PFA (PFA combined) value. Given the normal ranges for PFA EPI (84–160 seconds) and PFA ADP (61–121 seconds), we defined PFA combined as follows: if PFA EPI was within the normal range, PFA combined was set to the PFA EPI value; however, if PFA EPI was prolonged (>160 seconds), PFA combined was calculated as 160 seconds plus the excess duration of PFA ADP beyond 61 seconds (i.e. 160 seconds + [PFA ADP – 61 seconds]).
Between 2015 and 2019, a total of 819 biopsies were performed in 571 patients, of which 285 were performed on native kidneys and 534 on transplant kidneys. Figure 1 shows the patient flowchart and reasons for exclusion. Table 1 presents the baseline characteristics of both groups.
Figure 1Composition of the study cohort. PFA BT: platelet function analyser bleeding time.
Table 1Baseline characteristics, renal function, and coagulation parameters of the study population. Counts or medians and interquartile ranges (IQRs) are shown. PFA groups: normal bleeding time is defined as either PFA EPI normal or PFA EPI prolonged with PFA ADP normal. Prolonged bleeding time is defined as both PFA EPI and PFA ADP prolonged.
| Characteristic | Overall, n = 819 | Native, n = 285 | Transplant, n = 534 | ||
| Female sex, n (%) | 324 (40%) | 109 (38%) | 215 (40%) | ||
| Age (years) | 56 (45– 65) | 57 (42– 68) | 55 (46–63) | ||
| Biopsy days posttransplant (days) | N/A | 175 (89– 279) | |||
| Biopsy type | Surveillance | N/A | 337 (64) | ||
| Diagnostic | N/A | 192 (36) | |||
| Setting | Outpatient | 163 (57) | N/A | ||
| Inpatient | 122 (43) | N/A | |||
| Renal function (ml/min/1.73 m2) at biopsy | eGFR | 43 (26– 61) | 39 (19– 72) | 44 (30–58) | |
| eGFR groups | >30 | 577 (70) | 175 (61) | 402 (75) | |
| <30 | 242 (30) | 110 (39) | 132 (25) | ||
| Coagulation parameters at biopsy | Thrombocyte count (×109/l) | 236 (190– 286) | 249 (203– 303) | 226 (187– 274) | |
| Thrombocyte groups | ≥150 × 109/l | 739 (90) | 260 (91) | 479 (90) | |
| <150 × 109/l | 80 (9.8) | 25 (8.8) | 55 (10) | ||
| PFA Groups (sec) | Normal bleeding time | 685 (84) | 233 (82) | 452 (85) | |
| Prolonged bleeding time | 134 (16) | 52 (18) | 82 (15) | ||
eGFR: estimated glomerular filtration rate; EPI: epinephrin and collagen; PFA: platelet function analyser; N/A: not assessed
A total of 3.9% of biopsies (32 out of 819) resulted in at least one complication, with 45 complications recorded in total, as patients could have multiple complications from a single biopsy. Bleeding after biopsy was the most common complication in both groups. Multiple complications from a single biopsy were more common in the transplant group. Furthermore, the transplant group had more severe complications. The type and frequency of complications are summarised in table 2.
Table 2Complications after kidney biopsies. Counts and percentages are indicated.
| Complications | Overall, n = 819 | Native, n = 285 | Transplant, n =534 | |
| Biopsies with any complications | 32 (3.9) | 18 (6.3) | 14 (2.6) | |
| Primary outcome | Bleeding | 25 (3.1) | 13 (4.6) | 12 (2.2) |
| Need for transfusion | 2 (0.4) | |||
| Secondary outcome | Need for hospitalisation | 4 (0.7) | ||
| Need for ICU stay | 3 (0.6) | |||
| Other complications* | 11 (1.3) | 5 (1.8) | 6 (1.1) | |
| Total complications** | 45 | 18 | 27 | |
* Other complications: biopsy abortion, macrohematuria, haematoma, bladder tamponade, vomiting, and vasovagal reaction** More than one complication can occur after biopsy.
To further analyse the differences in bleeding complications, the distribution and frequencies of various clinical parameters were compared between biopsies with and without bleeding. The analysis of the entire study population revealed no significant differences in terms of sex, age, INR value, or platelet count (table 3).
Table 3Comparison of clinical and laboratory parameters between patients with bleeding complications and those without, stratified by native and transplant kidney biopsies.Counts and percentages or medians and interquartile ranges (IQRs) are presented.
| Patients with bleeding, n = 25 | Patient without bleeding, n = 794 | p-Value | ||
| Native kidney biopsies | n = 13 | n = 272 | ||
| Female sex | 6 (46.2) | 103 (38.2) | 0.75 | |
| Age (years) | 60 (51–76) | 56.5 (41–67) | 0.28 | |
| Coagulation parameters | INR | 1.1 (1.1–1.2) | 1.1 (1–1.1) | 0.06 |
| Thrombocyte count (×109/l) | 282 (251–420) | 248 (200.8–299) | 0.015 | |
| PFA (sec) prolonged | 3 (23.1) | 49 (18) | 0.92 | |
| eGFR (ml/min/1.73 m2) | 17 (10–30) | 39 (20–72.2) | 0.01 | |
| Setting | Outpatient | 2 (15.4) | 161 (59.2) | 0.005 |
| Inpatient | 11 (84.6) | 111 (40.8) | ||
| Transplant kidney biopsies | n = 12 | n = 522 | ||
| Female sex | 6 (50) | 209 (40) | 0.69 | |
| Age (years) | 57 (51–61) | 55 (45.2–63) | 0.79 | |
| Coagulation parameters | INR | 1.1 (1.0–1.1) | 1.1 (1.0–1.1) | 0.57 |
| Thrombocyte count (×109/l) | 204.5 (108.8–263.8) | 226.5 (188–273.8) | 0.23 | |
| PFA (s) prolonged | 7 (58.3) | 75 (14.4) | <0.001 | |
| eGFR (ml/min/1.73 m2) | 11 (7–25.8) | 44 (29–58) | <0.001 | |
| Hospitalisation | 4 (33.3) | 0 (0) | <0.001 | |
| Type of biopsy | Diagnostic | 9 (75) | 183 (35.4) | 0.01 |
| Surveillance | 3 (25) | 334 (64.6) | ||
| Time post-transplant (days) | 13 (6.5–36) | 176.5 (90–288) | <0.001 | |
eGFR: estimated glomerular filtration rate; PFA: platelet function analyser.
However, renal function was significantly lower in biopsies with bleeding complications, corresponding to a higher risk of bleeding in patients with low eGFR (table 4). Additionally, PFA BT was more frequently prolonged in biopsies with bleeding, indicating that patients with prolonged PFA BT are also at an increased risk of bleeding (see table 4).
Table 4Univariate and multivariate logistic regression model for all biopsies. The variables outpatient setting and time post-transplant were calculated in the native and transplant group respectively. Odds ratio (ORs) with 95% CIs are shown.
| Label | Univariable OR (95%CI) | p-Value | Multivariable OR (95% CI) | p-Value | |
| Female sex | 1.43 (0.63–3.18) | 0.38 | |||
| Age (years) | 1.02 (0.99–1.05) | 0.19 | |||
| INR | 6.17 (0.10–167.48) | 0.32 | |||
| Thrombocyte count (×109/l) | 1.00 (1.00–1.01) | 0.07 | |||
| PFA prolonged (s) | 3.60 (1.53–8.12) | 0.002 | 1.99 (0.83–4.79) | 0.124 | |
| eGFR* (ml/min/1.73 m2) | 3.96 (1.99–7.90) | 0.001 | 3.57 (1.76–7.23) | <0.001 | |
| Native group: inpatient | 7.98 (1.73–36.69) | 0.008 | |||
| Transplant group: 2 weeks post-transplant | 16.00 (4.88–61.49) | <0.001 | |||
eGFR: estimated glomerular filtration rate; PFA: platelet function analyser.
* OR for a decrease from an eGFR of 61–26.
In the analysis of the native kidney group, we observed more bleeding complications in inpatient biopsies than in outpatient biopsies (11 vs. 2 complications, p = 0.005). This resulted in a higher risk of bleeding in inpatients (table 3). However, inpatients also had lower eGFR values. When stratifying the analysis by eGFR using a median cut-off of 43 ml/min/1.73 m2, the point estimates for the association between patient setting and bleeding remained similar. However, the confidence intervals were wide (OR 7.07, 95% CI 0.62–80.88; OR 6.72, 95% CI 0.83–54.46).
In the transplant group, most bleeding events occurred in the first two weeks after transplantation (median time to bleeding after kidney transplantation 13 days, IQR 6.5–36 vs. median time to bleeding after kidney transplantation 176.5 days, IQR 90–288, p <0.001), highlighting a greater risk for bleeding within the first two weeks after transplantation (OR 16.00, 95% CI 4.88–61.49, p <0.001). PFA BT was more frequently prolonged in biopsies with bleeding, and the OR for cases with prolonged PFA compared with normal PFA was 8.34 (95% CI 2.6–28.8, p <0.001). Lastly, diagnostic biopsies had a higher risk of bleeding compared to surveillance biopsies and an OR of 5.48 (95% CI 1.46–20.48, p = 0.072) (table 3). However, a lower eGFR was observed in patients within two weeks of kidney transplantation (10.0 ml/min/1.73 m2, IQR 7.0–20.2 versus 47.5 ml/min/1.73 m2, IQR 34.8–61.0, p <0.001) in patients with prolonged PFA BT (33.0 ml/min/1.73 m2, IQR 13.5–50.8 versus 46 ml/min/1.73 m2, IQR 31–59.2, p <0.001) and in those undergoing a diagnostic biopsy (28.0 ml/min/1.73 m2, IQR 12.0–40.0 versus 51 ml/min/1.73 m2, IQR 41.0–63.0, p <0.001). In a stratified analysis, among patients with an eGFR above 43 ml/min/1.73 m2, the association between biopsy timing and bleeding complications had an OR of 0.13 (95% CI 1.94×10–40–9.28×1037). The association between diagnostic biopsies and bleeding complications had an OR of <0.006 (95% CI 4.62×10⁻³⁰–7.07×1024).
Median eGFR in patients with prolonged PFA BT was lower (29 ml/min/1.73 m2, IQR 9–51) than in patients with normal PFA BT (45 ml/min/1.73 m2, IQR 29–62, p <0.001). Correspondingly, in patients with an eGFR of <30 ml/min/1.73 m2, 28.5% had both PFA EPI and ADP BT prolonged. In patients with eGFR ≥30 ml/min, 11.3% had both PFA EPI and ADP BT prolonged. Figure 2 depicts the number of bleeding complications in relation to eGFR and PFA BT. The median platelet count was also significantly lower in patients with a prolonged PFA BT (median 216 × 109/l vs. 238 × 109/l, p = 0.004). All patients with a platelet count of ≤75 × 109 /l showed prolonged PFA EPI and ADP BT. In addition, the correlation between renal function and INR was significant (median 1.1 vs. 1.0, p <0.001).
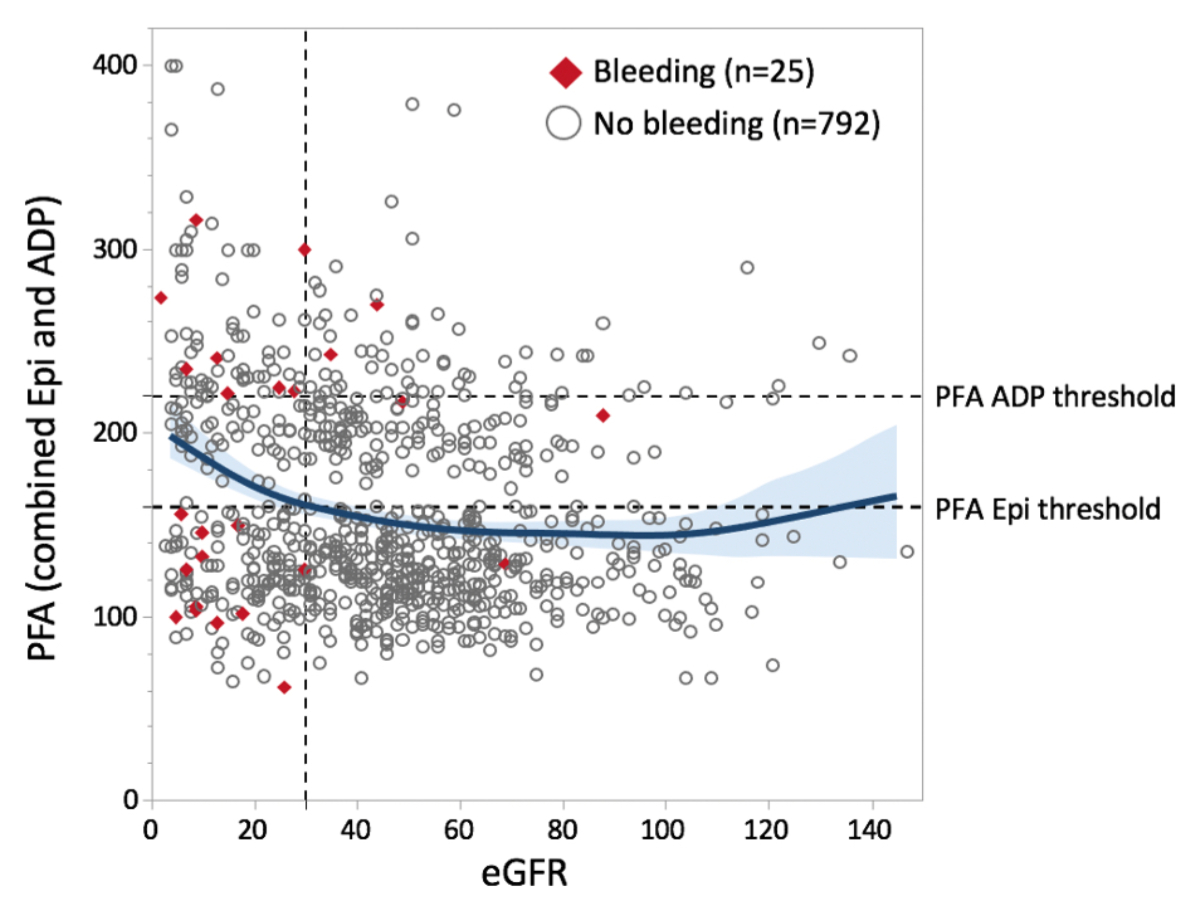
Figure 1Correlation between estimated glomerular filtration rate (eGFR) and combined PFA BT values in biopsies with and without bleeding. A spline function with a 95% confidence interval is shown in blue. BT: bleeding time; PFA: platelet function analyser; Epi: epinephrine and collagen
However, in the second model, which included the interaction term between eGFR and PFA values, we found a significant interaction, with an interaction p-value of 0.029. While lower eGFR was generally associated with increased bleeding risk (p <0.0001), this effect was more pronounced in patients with prolonged PFA BT. By contrast, in patients with higher eGFR, prolonged PFA BT was not significantly associated with bleeding risk (table 5).
Table 5Multivariable logistic regression model for all biopsies, including the interaction term between platelet function analyser (PFA) prolonged and estimated glomerular filtration rate (eGFR) values. Odds ratios (ORs) with 95% CIs are shown. eGFR was modelled using restricted cubic splines.
| Label | Multivariable OR (95% CI) | p-Value |
| PFA prolonged (s) | 8.90 (2.46–32.19) | 0.01 |
| eGFR* (ml/min/1.73 m2) | 4.30 (2.09–8.82) | <0.001 |
| Interaction eGFR* PFA prolonged | 0.028 |
* OR for decrease from an eGFR of 61–26.
In the multivariable logistic regression model, which included renal function and PFA BT, lower renal function was an independent risk factor for bleeding (Table 4). Figure 3 depicts a dose–response plot showing the relationship between eGFR, PFA BT, and the predicted OR for bleeding. PFA BT was not associated with bleeding when adjusted for eGFR values (Table 4). The model showed a significant interaction between eGFR and PFA BT. Correspondingly, among 46 patients with a prolonged PFA BT and an eGFR above 43 ml/min/1.73 m2, only one patient experienced a bleeding complication, whereas nine out of 79 patients with an eGFR below 43 ml/min/1.73 m2 had a bleeding complication.

Figure 3Restricted cubic spline plot of the association between the risk of bleeding and estimated glomerular filtration rate (eGFR) values (A) and combined platelet function analyser bleeding time (PFA BT) values (B). As a reference, an eGFR value of 30 ml/min/1.73 m2 and a PFA value of 139 were used. The dotted line represents an odds ratio of 1. The grey area represents the 95% confidence interval.
Complications after kidney biopsy are rare, but they can be painful, costly, and dangerous in some cases. The current analysis evaluated risk factors and predictors of complications, with a focus on bleeding time. The study revealed four major findings.
First, this study shows that kidney biopsies are generally safe procedures, with rare occurrences of bleeding complications. Bleeding complications are the most common complication associated with kidney biopsy. This study suggests that impaired eGFR and prolonged PFA BT, especially in patients with impaired kidney function, are strongly associated with bleeding complications. In addition, a short time elapsed after kidney transplantation increases the risk of bleeding following an allograft biopsy. Furthermore, for native kidney biopsies, inpatients are at a higher risk of bleeding than outpatients. However, these associations are partly explained by a lower eGFR in the exposed group.
In our analysis, kidney biopsies carried a risk of at least one complication in 6.3% of native and 2.6% of transplant kidneys. These rates are lower than those reported in previous studies; however, they are similar to findings from a recent single-centre study from Zurich [21], confirming the safety of the procedure. The complication rate for native kidney biopsies was higher than for transplant biopsies. Additionally, we observed a greater frequency and severity of complications after transplant biopsies. These results are consistent with many, but not all, previous studies [15]. The variability between results may be attributed to several factors, including different definitions of complications; variation in coagulation testing, biopsy technique, and materials; physician experience; and the extent and duration of impaired kidney function.
Bleeding emerged as the predominant complication, with a risk of 4.6% in native kidneys and 2.2% in transplant kidneys. The literature shows varying data on bleeding complications [16], often categorised into those that require treatment and those that do not [1, 2, 5, 8, 17]. Previous studies have reported a 19% average risk of bleeding without treatment for native kidney biopsies, with 2% requiring treatment. Transplant biopsies, on average, show a 14.5% risk without treatment and 1.5% requiring treatment [1–17]. By contrast, the bleeding rates in our study were notably lower, possibly due to our strict definition (i.e. a haemoglobin drop >10 g/l within 48 hours). Prior studies often define bleeding based on descriptive criteria, irrespective of clinical significance or haemoglobin drop [2]. The variability in bleeding complications may also stem from the conditions during kidney biopsies, as discussed earlier. Conversely, blood transfusion rates after bleeding complications are consistently low across studies, except in three instances [4, 16, 18], in which transfusion needs were less than 2%, likely due to strict indications and documentation.
Our third finding pertains to the factors associated with bleeding complications. We observed a significant association between low eGFR and the risk of bleeding. Analysis using restricted cubic splines revealed no linear association between eGFR and bleeding complications. However, the risk of bleeding was elevated only in patients with a low eGFR (e.g. <30 ml/min/1.73 m2). These findings are consistent with those of previous studies [4, 13]. Although a prolonged PFA BT was associated with an increased risk of bleeding in transplant kidney biopsies, this association could be explained by a lower eGFR and was not observed in patients with an eGFR above 43 ml/min/1.73 m2. In the overall cohort, we found a significant interaction between PFA BT and eGFR, with PFA BT showing a significant association with bleeding risk only in the model that included the interaction term. This suggests that PFA BT values are particularly associated with bleeding complications in patients with impaired renal function. We also observed a significant interaction between PFA BT and eGFR, which attenuates the direct relationship between prolonged PFA BT in patients with low eGFR. This finding may be explained by CKD-related thrombocytopathy [22].
Thrombocyte count correlated poorly with bleeding complications, but a thrombocyte count of <150,000/l was significantly associated with an increased risk of pathological PFA BT. Furthermore, PFA BT was consistently pathologic when the thrombocyte count was below 75 × 109/l. By contrast, INR showed no correlation with bleeding risk. However, this finding should be interpreted with caution, as no patients in this analysis had prolonged INR.
Our analysis showed that the timing of bleeding complications in transplant kidneys is crucial, as most complications occurred within the first 14 days after kidney transplantation. This observation can be attributed to several factors. (1) Delayed graft function: 132 newly transplanted patients (24.7%) had an eGFR of less than 30 ml/min at the time of biopsy, representing a significant risk of bleeding. Our analysis also showed that the increased risk of bleeding within 14 days after transplantation was primarily due to the lower eGFR in these patients. (2) Incomplete scarring of the graft area, which results in the absence of a protective capsule that could tamponade bleeding. This mechanism is absent in freshly transplanted kidneys. (3) Most complications occurred in diagnostic biopsies, typically performed in patients with acute impairment of kidney function or other signs of pathology, which further increases the risk of bleeding in vulnerable patients. Therefore, it is crucial to carefully consider the necessity and timing of diagnostic biopsies to minimise the risk of complications.
The main strength of this study is its focus on precisely defined bleeding complications, allowing us to assume that all bleeding events after biopsies were captured. Furthermore, complete patient data were collected, with no missing values. All biopsies were performed according to the same guidelines throughout the study period.
This study has several limitations. Firstly, the single-centre observational design limits the generalisability of our findings. The observational design may have resulted in missed undocumented complications, potentially underestimating complication rates. However, given our focus on significant bleeding as the primary endpoint, this is less likely. Secondly, due to the subjective nature of pain, which is experienced individually, pain could not be included, possibly leading to an underestimation of overall complications. Thirdly, the analysis was constrained by the low number of bleeding events, preventing regression analysis within the transplant and native kidney biopsy subgroups.
A low eGFR, especially below 30 ml/min, is associated with an increased risk of bleeding complications in both native and transplant kidney biopsies. PFA BT values may be particularly relevant in patients with impaired kidney function.
The protocol and the ethical approval are available upon reasonable request from the primary author, Céline Fontana. The statistical code for the analysis can be obtained by contacting Matthias Diebold.
No funding was received for this study.
All authors have completed and submitted the International Committee of Medical Journal Editors form for disclosure of potential conflicts of interest. No potential conflict of interest related to the content of this manuscript was disclosed.
1. Trajceska L, Severova-Andreevska G, Dzekova-Vidimliski P, Nikolov I, Selim G, Spasovski G, et al. Complications and Risks of Percutaneous Renal Biopsy. Open Access Maced J Med Sci. 2019 Mar;7(6):992–5.
2. Feldmann Y, Böer K, Wolf G, Busch M. Complications and monitoring of percutaneous renal biopsy - a retrospective study . Clin Nephrol. 2018 Apr;89(4):260–8.
3. Redfield RR, McCune KR, Rao A, Sadowski E, Hanson M, Kolterman AJ, et al. Nature, timing, and severity of complications from ultrasound-guided percutaneous renal transplant biopsy. Transpl Int. 2016 Feb;29(2):167–72.
4. Brachemi S, Bollée G. Renal biopsy practice: what is the gold standard? World J Nephrol. 2014 Nov;3(4):287–94.
5. Schorr M, Roshanov PS, Weir MA, House AA. Frequency, Timing, and Prediction of Major Bleeding Complications From Percutaneous Renal Biopsy. Can J Kidney Health Dis. 2020 May;7:2054358120923527.
6. Corapi KM, Chen JL, Balk EM, Gordon CE. Bleeding complications of native kidney biopsy: a systematic review and meta-analysis. Am J Kidney Dis. 2012 Jul;60(1):62–73.
7. Furness PN, Philpott CM, Chorbadjian MT, Nicholson ML, Bosmans JL, Corthouts BL, et al. Protocol biopsy of the stable renal transplant: a multicenter study of methods and complication rates. Transplantation. 2003 Sep;76(6):969–73.
8. Stratta P, Canavese C, Marengo M, Mesiano P, Besso L, Quaglia M, et al. Risk management of renal biopsy: 1387 cases over 30 years in a single centre. Eur J Clin Invest. 2007 Dec;37(12):954–63.
9. Kawaguchi T, Nagasawsa T, Tsuruya K, Miura K, Katsuno T, Morikawa T, et al.; Committee of Practical Guide for Kidney Biopsy 2019. A nationwide survey on clinical practice patterns and bleeding complications of percutaneous native kidney biopsy in Japan [Erratum in: Clin Exp Nephrol. 2020 May;24] [5] [:402-403. doi: 10.1007/s10157-020-01883-y. PMID: 32189101; PMCID: PMC7174253]. Clin Exp Nephrol. 2020 May;24(5):389–401.
10. Schwarz A, Gwinner W, Hiss M, Radermacher J, Mengel M, Haller H. Safety and adequacy of renal transplant protocol biopsies. Am J Transplant. 2005 Aug;5(8):1992–6.
11. Morgan TA, Chandran S, Burger IM, Zhang CA, Goldstein RB. Complications of Ultrasound-Guided Renal Transplant Biopsies. Am J Transplant. 2016 Apr;16(4):1298–305.
12. Ferguson C, Winters S, Jackson S, McToal M, Low G. A retrospective analysis of complication and adequacy rates of ultrasound-guided native and transplant non-focal renal biopsies. Abdom Radiol (NY). 2018 Aug;43(8):2183–9.
13. Xu DM, Chen M, Zhou FD, Zhao MH. Risk Factors for Severe Bleeding Complications in Percutaneous Renal Biopsy. Am J Med Sci. 2017 Mar;353(3):230–5.
14. Andrulli S, Rossini M, Gigliotti G, La Manna G, Feriozzi S, Aucella F, et al.; ITA-KID-BIO-Group. The risks associated with percutaneous native kidney biopsies: a prospective study. Nephrol Dial Transplant. 2023 Feb;38(3):655–63.
15. Whittier WL, Gashti C, Saltzberg S, Korbet S. Comparison of native and transplant kidney biopsies: diagnostic yield and complications. Clin Kidney J. 2018 Oct;11(5):616–22.
16. Palsson R, Short SA, Kibbelaar ZA, Amodu A, Stillman IE, Rennke HG, et al. Bleeding Complications After Percutaneous Native Kidney Biopsy: Results From the Boston Kidney Biopsy Cohort. Kidney Int Rep. 2020 Mar;5(4):511–8.
17. Manno C, Strippoli GF, Arnesano L, Bonifati C, Campobasso N, Gesualdo L, et al. Predictors of bleeding complications in percutaneous ultrasound-guided renal biopsy. Kidney Int. 2004 Oct;66(4):1570–7.
18. van den Hoogen MW, Verbruggen BW, Polenewen R, Hilbrands LB, Nováková IR. Use of the platelet function analyzer to minimize bleeding complications after renal biopsy. Thromb Res. 2009;123(3):515–22.
19. von Elm E, Altman DG, Egger M, Pocock SJ, Gøtzsche PC, Vandenbroucke JP; STROBE Initiative. The Strengthening the Reporting of Observational Studies in Epidemiology (STROBE) statement: guidelines for reporting observational studies. J Clin Epidemiol. 2008 Apr;61(4):344–9.
20. Levey AS, Stevens LA, Schmid CH, Zhang YL, Castro AF 3rd, Feldman HI, et al.; CKD-EPI (Chronic Kidney Disease Epidemiology Collaboration). A new equation to estimate glomerular filtration rate [Erratum in: Ann Intern Med. 2011 Sep 20;155] [6] [:408. PMID: 19414839; PMCID: PMC2763564]. Ann Intern Med. 2009 May;150(9):604–12.
21. Bonani M, Seeger H, Weber N, Lorenzen JM, Wüthrich RP, Kistler AD. Safety of Kidney Biopsy when Performed as an Outpatient Procedure. Kidney Blood Press Res. 2021;46(3):310–22.
22. Kaw D, Malhotra D. Platelet dysfunction and end-stage renal disease. Semin Dial. 2006;19(4):317–22.