Determinants and health-related consequences of screen time in children and adolescents:
post-COVID-19 insights from a prospective cohort study
DOI: https://doi.org/https://doi.org/10.57187/s.4247
Viviane
Richardab,
Elsa Lortheac,
Roxane
Dumontab,
Andrea
Loizeaua,
Hélène
Bayssona,
María-Eugenia
Zaballaa,
Julien
Lamoura,
Mayssam
Nehmead,
Rémy P. Barbee,
Klara M. Posfay-Barbef,
Idris
Guessousbd*,
Silvia
Stringhiniabg*
a Unit of Population Epidemiology,
Division of Primary Care Medicine, Geneva University Hospitals, Geneva,
Switzerland
b Department of Health and Community
Medicine, Faculty of Medicine, University of Geneva, Geneva, Switzerland
c Université Paris Cité, Inserm,
INRAE, Centre for Research in Epidemiology and Statistics Paris (CRESS), Paris,
France
d Division of Primary Care Medicine,
Geneva University Hospitals, Geneva, Switzerland
e Division of Child and Adolescent
Psychiatry, Department of Woman, Child, and Adolescent Medicine, Geneva
University Hospitals, Geneva, Switzerland
f Department of Paediatrics, Gynaecology
and Obstetrics, Paediatric Infectious Disease Unit, Geneva University Hospitals
and Faculty of Medicine, Geneva, Switzerland
g School of Population and Public
Health and Edwin S.H. Leong Centre for Healthy Aging, Faculty of Medicine,
University of British Columbia, Vancouver, Canada
* These
authors contributed equally to this manuscript.
** For a full list of members of the SEROCoV-KIDS study group, see Acknowledgments
Summary
AIMS: This study aims to provide age-specific
prevalence of time spent on-screen among children and adolescents, to identify its
sociodemographic and family-related determinants and to assess its impact on physical
and psychosocial health outcomes.
METHODS: Data was drawn from the SEROCoV-KIDS
prospective cohort study, which includes randomly selected children living in Geneva,
Switzerland. Daily screen time, sociodemographic and family characteristics were
collected at baseline (December 2021 to June 2022). Physical and psychosocial health
outcomes were measured at one-year follow-up.
RESULTS: Among 674 children (2–8 years old),
752 preadolescents (9–13 years old) and 434 adolescents (14–17 years old), median
daily screen time was 0h29, 1h14 and 3h18, respectively. Lower parental education
and poorer parenting practices were associated with higher screen time in all age
groups. In children only, poor parental mental health (+14 minutes/day; 95% CI:
2–27) and work-family conflicts (+6 minutes/day; 95% CI: 2–10) were related to increased
screen time. After adjustment, elevated screen time was associated with an increased
likelihood of poor physical-, emotional- and school-related quality of life in preadolescents
and adolescents and of social difficulties in adolescents one year later.
CONCLUSION: Almost all children engage with
screens, but those from socially disadvantaged backgrounds and with strained families
face a heightened risk of prolonged screen time. The health consequences we identified
call for close monitoring.
Introduction
The prevalence of screen use has risen notably
among children and adolescents over the past few decades [1]. Average recreational
screen time of European adolescents rose from 4 to 6.5 hours a day between 2002
and 2014, while in Switzerland the proportion of adolescents spending more than
2 hours per day on-screen jumped from 61% to 81% over the same period [2]. In 2018,
average weekend screen time of 11–15-year-olds living in Switzerland was as high
as 8 hours per day [3]. The shift to many activities online during the COVID‑19
pandemic likely contributed to an acceleration of this trend, as screen time increased
globally during that period [4], including in Switzerland [5], and has remained
elevated ever since [6, 7]. These patterns are alarming given that studies have
uncovered adverse effects of screen time on the wellbeing of young individuals.
Moreover, with the widespread adoption of mobile devices usable anywhere with limited
adult supervision, screen use keeps evolving quickly [1, 8], and reports from ten
years ago may already be outdated [1, 8].
Several sociodemographic and family characteristics
have been related to screen time among children and adolescents, but findings are
mixed across studies [9–12]. Older age seems to be a common predictor of higher
screen time [9, 10]. Disadvantaged socioeconomic circumstances were shown to be
associated with increased time spent on-screen in two systematic reviews [9, 11],
while two others found inconsistent results [10, 12]. Family characteristics such
as poor parental mental health or a lack of screen rules might also be related to
higher screen time, but with conflicting results across reviews [9, 10, 12]. A previous
report suggests that determinants of screen time vary depending on context and highlights
the need for country-specific studies [13].
While screen use can offer learning and communication
opportunities [1], elevated screen time has been linked to various adverse physical
and psychosocial health outcomes in young populations [1]. Several meta-analyses
reported an increased risk of excess weight and poor self-rated health among children
and adolescents with higher screen time [14–16]. According to the displacement hypothesis,
this could be attributed to the shift of time dedicated to health-promoting activities,
such as exercise and sleep, towards screen use [17]. Moreover, a systematic review
found moderate evidence linking screen time to depressive symptoms and diminished
quality of life. It also found weaker evidence suggesting connections with behavioural
issues, anxiety, poorer psychosocial health and lower educational achievements.
[16]. These findings mirror those from a systematic review of longitudinal studies
showing a small but significant effect of screen time on depressive symptoms among
adolescents, but lacking evidence to support a relationship with other internalising
problems [18]. The negative effect of screen time on young individuals’ psychosocial
wellbeing could be explained by the displacement of activities beneficial to health
and by screen content if violent, age-inappropriate, triggering upward social comparison
or exposing them to cyberbullying [19]. Importantly, these associations might be
evolving along with the increasing diversity of screen uses including social interactions,
gaming, information seeking and content creation [1].
Therefore, we aimed (1) to describe up-to-date
post-pandemic prevalence of screen time and adherence to corresponding recommendations
by age, (2) to identify sociodemographic and family determinants of screen time,
and (3) to examine its effects on subsequent physical and psychosocial health outcomes.
Materials and methods
Study design
Data was extracted from the SEROCoV-KIDS population-based
prospective cohort study, which was designed to evaluate the direct and indirect
impacts of the COVID-19 pandemic on the health of children and adolescents, in Geneva,
Switzerland. Eligibility criteria were to be aged between 6 months and 17 years
old and living in the canton of Geneva at baseline. Eligible children and adolescents
were randomly selected from state registries either specifically for this study
or for COVID-19 seroprevalence studies conducted in our unit [20–23]. The index
registries were provided by the Swiss Federal Office of Statistics or the Geneva
Cantonal Office for Population and Migration. Participants aged 2–17 years at enrollment
were included in the present analysis and categorised as follows: children, aged
2–8 years; preadolescents, aged 9–13 years; and adolescents, aged 14–17 years (figure
S1 in the appendix).
Data was collected at baseline between December
2021 and June 2022 and during two follow-up assessments conducted about 6 months
apart (first follow-up, between September 2022 and February 2023; second follow-up,
between May 2023 and September 2023). Online questionnaires were completed on the
Specchio-Hub online platform [24] by the referent parents (or legal guardian) on
behalf of their participating children. Adolescents, aged 14 years or above, also
completed their own questionnaires specifically tailored to their age group.
Measures
Adolescents self-reported screen time and health-related
quality of life (HRQoL); all other measures were parent-reported (table S1 in
the appendix).
Screen time
At baseline, participants were asked how many
hours per weekday and weekend day they (or their child) spend on-screen (smartphone,
computer, television, tablet, video game) for recreational purposes. Average screen
time per day was calculated as (weekday × 5 + weekend day × 2) / 7.
Non-adherence to recommendations was defined as spending more than one hour per
day on-screen for children under five years according to the World Health Organization’s
(WHO) guidelines [25]. For older children, neither the WHO nor Swiss health authorities
provide a threshold and we used the daily two hours limit proposed by Canadian and
Australian guidelines [26, 27].
Determinants
Based on the literature, the following sociodemographic
characteristics assessed at baseline were considered as potential determinants.
The educational level attained by each parent was combined to obtain the parents’
highest education (lower than college vs college or higher). The parents’
birth country was grouped into at least one born in Switzerland vs both
born abroad. Parents who stated that they were raising their child(ren) alone
were defined as a single parent, in which case only their education and birth country
was considered. The household financial situation was deemed good if its
members could cover their needs and face unforeseen expenses and average-to-poor
if they could hardly cover unforeseen expenses or could not meet current needs.
We additionally evaluated family determinants
at baseline including having siblings (yes vs no) and referent parent’s
mental health (good vs average-to-poor), as well as the following
family dynamics treated as continuous variables. Family adjustment, which refers
to the within-family support and emotional resources to face challenges, was measured
as the combination of the parental adjustment, family relationships and parental
teamwork scales from the parenting and family adjustment scales (PAFAS) [28, 29].
Parenting practices were assessed by grouping the following PAFAS scales: parental
consistency, coercive parenting, positive encouragement and parent-child relationship
[28, 29]. The work-family conflict scale was additionally included [30]. Family
dynamics were measured at the first follow-up, about eight months after the baseline
assessment (mean: 39.2 weeks; standard deviation [SD]: 9.9). We did not expect these
constructs to drastically change within this interval and decided to assess their
effect on screen time along with the sociodemographic characteristics collected
at baseline.
Health outcomes
Physical and psychosocial health outcomes were
measured at baseline and at the second follow-up assessment, about 16 months later
(mean: 71.8 weeks; SD: 9.9) and dichotomised with published thresholds corresponding
to impaired health (table S1 in the appendix).
Body mass index (BMI) z-scores for age were
calculated using the anthro [31] and anthroplus [32] R packages from the WHO. Excess
weight was defined as a z-score above +2 SD for children aged below 5 years and
above +1 SD for older children [33]. The physical, emotional, social and school
health-related quality of life were assessed with the corresponding subscales of
the Pediatric Quality of Life Inventory (PedsQL) Short Form [34]. A poor health-related
quality of life was defined with thresholds provided by Varni et al. [35]. The Strengths
and Difficulties Questionnaire (SDQ) was used to evaluate behavioural problems [36].
As recommended for community samples, internalising problems were assessed by combining
the emotional and peer problems subscales, and externalising problems were computed
by adding the conduct problems and hyperactivity subscales, while prosocial behaviours
were separately analysed [37]. Behavioural problems were defined with clinical thresholds
(90th percentile) based on United Kingdom norms available on https://sdqinfo.org/.
Covariates
The following variables were collected at baseline:
age, sex, daily hours of physical activity, participation in extracurricular activities
and number of close friends (only available for preadolescents and adolescents).
For 2-year-old children, physical activity and extracurricular activities were measured
at the second follow-up.
Statistical analyses
Median screen time and prevalence of non-adherence
to recommendations were weighted according to the Geneva population’s age and sex
distribution [38]. Multivariate models were specified following hypothesised relationships
between study variables (figure S2 in the appendix). Sociodemographic determinants
of screen
time in minutes, the primary outcome, were assessed together in age- and sex-adjusted
models. Family determinants were separately evaluated in models adjusted for age,
sex and sociodemographic variables to estimate their respective direct effect [39].
Adherence to screen recommendations and screen time in percentage difference (using
log transformation) were examined as secondary outcomes with the same set of adjustments.
The associations between screen time at baseline and each subsequent health outcome
after one year were examined with three distinct models to evaluate the effect of
different adjustments. The first model was adjusted for age, sex and sociodemographic
variables and the second one was further adjusted for physical activity, extracurricular
activity and the number of friends; the main model presented in the results further
controlled for the baseline level of the examined health outcome. The month of screen
time measurement was tested as a potential covariate but was not included in the
final models as there was no association with screen time (p-value >0.1). Generalised
linear models taking the household clustering of data into account were performed
using the R survey package [40]. Linear models following a Gaussian distribution
were performed for continuous outcomes and robust Poisson models following a quasi-Poisson
distribution were chosen for binary outcomes. The assumptions of the linear regression
models were evaluated through visual inspection of the residuals and were deemed
to be adequately met.
Missing data
Parent-reported information at the first and
second follow-up was available for 1532/1860 (82.4%) and 1277 (68.7%) participants,
respectively (figure S1 in the appendix). A total of 393/434 (90.5%) adolescents additionally
completed a baseline questionnaire and 270 (62.2%) a second follow-up. Questionnaire
non-response was more frequent among older participants with foreign origin, a disadvantaged
financial background and a poor health-related quality of life (table
S2 in the appendix). Following Seaman et al. [41], we opted for a cautious approach
to handle missing
data, which combines inverse probability weighting (IPW) for questionnaire non-response
and multiple imputation (MI) for item non-response. Propensities to respond to the
first and second follow-up questionnaires were separately quantified at the household
level using generalised linear models. The inverse of the estimated propensity to
respond was used to weight the main models. Missing items were imputed by chained
equations with 10 imputed datasets and 1000 iterations using the R mice package
[42].
All analyses were stratified by age group to
account for the fact that the associations under study may vary depending on age.
Estimations were performed with R 4.2.2, available under the GNU General Public
License. The R tidyverse package was used for data management and visualisation
[43]; codes are accessible to researchers upon request. A formal study protocol
was not pre-registered.
Ethics approval and consent to participate
The Geneva Cantonal Commission for Research
Ethics approved the study (ID: 2021-01973). All referent adults, as well as adolescents
aged 14 years or older provided written consent to participate. Children gave oral
assent to participate.
Results
A total of 1860 participants were included:
674 children (mean age: 5.5 years), 752 preadolescents (mean age: 10.9 years) and
434 adolescents (mean age: 15.4 years, table 1). Intraclass correlation at the household
level ranged from 0.43 among adolescents to 0.89 among children.
Table 1Sociodemographic, family and
health characteristics of children (2–8 years old), preadolescents (9–13 years
old) and adolescents (14–17 years old) according to non-adherence to screen
recommendations and screen time.
|
Children (n = 672) |
Preadolescents (n = 750) |
Adolescents (n = 391) |
| Total |
Non-adherence |
Time (hours/day) |
Total |
Non-adherence |
Time (hours/day) |
Total |
Non-adherence |
Time (hours/day) |
| n |
n (%) |
Median (Q1–Q3) |
n |
n (%) |
Median (Q1–Q3) |
n |
n (%) |
Median (Q1–Q3) |
| Determinants |
| Ageb |
5.5 (1.9) |
4.9 (1.9) |
– |
10.9 (1.4) |
11.6 (1.4) |
– |
15.4 (1.1) |
15.5 (1.1) |
– |
| Sex |
Male |
333 |
21 (6.3%) |
0h30 (0h15–0h49) |
382 |
74 (19.4%) |
1h17 (0h39–1h51) |
187 |
147 (78.6%) |
3h17 (2h15–4h54) |
| Female |
338 |
23 (6.8%) |
0h30 (0h15–0h58) |
367 |
76 (20.7%) |
1h09 (0h39–1h56) |
203 |
158 (77.8%) |
3h04 (2h09–4h26) |
| Other |
1 |
0 (0.0%) |
– |
1 |
0 (0.0%) |
– |
1 |
1 (100.0%) |
– |
| Parents’ birth country |
At least one in Switzerland |
403 |
20 (5.0%) |
0h28 (0h15–0h49) |
465 |
84 (18.1%) |
1h09 (0h39–1h47) |
260 |
207 (79.6%) |
3h09 (2h17–4h34) |
| Abroad |
269 |
24 (8.9%) |
0h34 (0h17–1h00) |
285 |
66 (23.2%) |
1h17 (0h39–1h56) |
131 |
99 (75.6%) |
3h09 (2h06–4h34) |
| Parents’ highest education |
College or higher |
583 |
32 (5.5%) |
0h28 (0h15–0h47) |
617 |
112 (18.2%) |
1h09 (0h39–1h47) |
325 |
247 (76.0%) |
3h00 (2h09–4h17) |
| Lower than college |
89 |
12 (13.5%) |
1h00 (0h34–1h26) |
133 |
38 (28.6%) |
1h30 (1h06–2h17) |
66 |
59 (89.4%) |
4h00 (2h52–6h04) |
| Household financial situation |
Good |
529 |
28 (5.3%) |
0h28 (0h13–0h47) |
563 |
112 (19.9%) |
1h09 (0h39–1h56) |
305 |
244 (80.0%) |
3h04 (2h13–4h30) |
| Average to poor |
110 |
14 (12.7%) |
0h39 (0h24–1h12) |
136 |
31 (22.8%) |
1h17 (0h51–1h49) |
64 |
46 (71.9%) |
3h26 (1h46–5h56) |
| Missingc |
33 |
2 (6.1%) |
0h30 (0h17–0h47) |
51 |
7 (13.7%) |
0h56 (0h39–1h39) |
22 |
16 (72.7%) |
3h26 (1h57–4h13) |
| Single parenthood |
No |
607 |
41 (6.8%) |
0h30 (0h15–0h56) |
673 |
123 (18.3%) |
1h13 (0h39–1h47) |
348 |
272 (78.2%) |
3h04 (2h09–4h31) |
| Yes |
27 |
1 (3.7%) |
0h39 (0h17–1h04) |
43 |
20 (46.5%) |
1h56 (1h03–2h34) |
23 |
19 (82.6%) |
4h26 (2h51–5h15) |
| Missing |
38 |
2 (5.3%) |
0h28 (0h17–0h56) |
34 |
7 (20.6%) |
1h08 (0h39–1h47) |
20 |
15 (75.0%) |
3h17 (2h05–4h00) |
| Siblings |
Yes |
600 |
38 (6.3%) |
0h30 (0h15–0h56) |
682 |
130 (19.1%) |
1h16 (0h39–1h50) |
362 |
287 (79.3%) |
3h09 (2h17–4h30) |
| No |
72 |
6 (8.3%) |
0h34 (0h09–1h00) |
68 |
20 (29.4%) |
1h17 (0h44–2h17) |
29 |
19 (65.5%) |
3h13 (1h47–5h26) |
| Referent parent mental health |
Good |
570 |
29 (5.1%) |
0h30 (0h15–0h47) |
656 |
127 (19.4%) |
1h13 (0h39–1h47) |
354 |
273 (77.1%) |
3h09 (2h09–4h34) |
| Average to poor |
101 |
15 (14.9%) |
0h39 (0h19–1h13) |
94 |
23 (24.5%) |
1h17 (0h46–2h00) |
37 |
33 (89.2%) |
3h17 (2h17–5h09) |
| Missing |
1 |
0 (0.0%) |
– |
– |
– |
– |
– |
– |
– |
| Family adjustmentbd |
8.2 (5.0) |
9.3 (5.1) |
– |
8.3 (4.9) |
8.8 (5.1) |
– |
8.3 (4.8) |
8.6 (4.9) |
– |
| Parenting practicesbd |
12.2 (3.9) |
13.3 (3.5) |
– |
12.4 (4.7) |
13.7 (5.6) |
– |
13.0 (4.9) |
13.3 (5.0) |
– |
| Work-family conflictbd |
2.0 (0.8) |
2.2 (0.8) |
– |
2.0 (0.8) |
2.0 (0.8) |
– |
1.9 (0.8) |
2.0 (0.8) |
– |
| Outcomes |
| Weight status |
Normal weight |
382 |
19 (5.0%) |
0h28 (0h13–0h47) |
434 |
87 (20.0%) |
1h13 (0h39–1h47) |
233 |
185 (79.4%) |
3h09 (2h09–4h34) |
| Excess weight |
72 |
7 (9.7%) |
0h39 (0h19–1h07) |
99 |
24 (24.2%) |
1h34 (0h57–2h00) |
22 |
19 (86.4%) |
3h49 (2h35–5h04) |
| Missing |
218 |
18 (8.3%) |
0h34 (0h17–1h00) |
217 |
39 (18.0%) |
1h09 (0h39–1h47) |
136 |
102 (75.0%) |
3h00 (2h06–4h26) |
| Physical health-related quality of life |
Good |
436 |
25 (5.7%) |
0h28 (0h14–0h49) |
503 |
98 (19.5%) |
1h17 (0h39–1h51) |
284 |
218 (76.8%) |
3h00 (2h09–4h26) |
| Poor |
24 |
0 (0.0%) |
0h32 (0h17–0h49) |
31 |
13 (41.9%) |
1h47 (1h08–2h43) |
35 |
30 (85.7%) |
4h17 (2h26–6h02) |
| Missing |
212 |
19 (9.0%) |
0h34 (0h17–1h00) |
216 |
39 (18.1%) |
1h09 (0h39–1h47) |
72 |
58 (80.6%) |
3h17 (2h24–4h34) |
| Emotional health-related quality of life |
Good |
293 |
13 (4.4%) |
0h28 (0h15–0h47) |
393 |
76 (19.3%) |
1h17 (0h39–1h51) |
186 |
140 (75.3%) |
2h58 (2h05–4h20) |
| Poor |
167 |
12 (7.2%) |
0h28 (0h15–0h52) |
141 |
35 (24.8%) |
1h17 (0h47–2h00) |
133 |
108 (81.2%) |
3h34 (2h17–5h09) |
| Missing |
212 |
19 (9.0%) |
0h34 (0h17–1h00) |
216 |
39 (18.1%) |
1h09 (0h39–1h47) |
72 |
58 (80.6%) |
3h17 (2h24–4h34) |
| Social health-related quality of life |
Good |
394 |
19 (4.8%) |
0h28 (0h15–0h47) |
455 |
94 (20.7%) |
1h17 (0h39–1h56) |
287 |
221 (77.0%) |
3h00 (2h09–4h26) |
| Poor |
66 |
6 (9.1%) |
0h26 (0h13–0h57) |
79 |
17 (21.5%) |
1h17 (0h47–1h56) |
32 |
27 (84.4%) |
4h21 (2h20–6h40) |
| Missing |
212 |
19 (9.0%) |
0h34 (0h17–1h00) |
216 |
39 (18.1%) |
1h09 (0h39–1h47) |
72 |
58 (80.6%) |
3h17 (2h24–4h34) |
| School health-related quality of life |
Good |
397 |
22 (5.5%) |
0h28 (0h13–0h47) |
416 |
80 (19.2%) |
1h13 (0h36–1h52) |
181 |
134 (74.0%) |
2h51 (2h00–4h00) |
| Poor |
63 |
3 (4.8%) |
0h36 (0h17–1h00) |
118 |
31 (26.3%) |
1h21 (0h56–2h12) |
138 |
114 (82.6%) |
3h34 (2h17–5h29) |
| Missing |
212 |
19 (9.0%) |
0h34 (0h17–1h00) |
216 |
39 (18.1%) |
1h09 (0h39–1h47) |
72 |
58 (80.6%) |
3h17 (2h24–4h34) |
| Internalising problems |
No |
446 |
24 (5.4%) |
0h28 (0h15–0h49) |
504 |
103 (20.4%) |
1h17 (0h39–1h56) |
234 |
187 (79.9%) |
3h15 (2h14–4h34) |
| Yes |
14 |
1 (7.1%) |
0h19 (0h10–0h36) |
30 |
8 (26.7%) |
1h17 (0h56–2h03) |
21 |
17 (81.0%) |
3h34 (2h21–4h39) |
| Missing |
212 |
19 (9.0%) |
0h34 (0h17–1h00) |
216 |
39 (18.1%) |
1h09 (0h39–1h47) |
136 |
102 (75.0%) |
3h00 (2h06–4h26) |
| Externalising problems |
No |
431 |
23 (5.3%) |
0h28 (0h15–0h49) |
518 |
106 (20.5%) |
1h17 (0h39–1h56) |
252 |
201 (79.8%) |
3h17 (2h12–4h35) |
| Yes |
29 |
2 (6.9%) |
0h19 (0h13–0h39) |
16 |
5 (31.2%) |
1h32 (1h15–2h17) |
3 |
3 (100.0%) |
2h47 (2h45–3h30) |
| Missing |
212 |
19 (9.0%) |
0h34 (0h17–1h00) |
216 |
39 (18.1%) |
1h09 (0h39–1h47) |
136 |
102 (75.0%) |
3h00 (2h06–4h26) |
| Antisocial behaviours |
No |
394 |
22 (5.6%) |
0h28 (0h15–0h49) |
456 |
89 (19.5%) |
1h15 (0h39–1h48) |
217 |
170 (78.3%) |
3h09 (2h09–4h26) |
| Yes |
66 |
3 (4.5%) |
0h22 (0h10–0h45) |
78 |
22 (28.2%) |
1h34 (0h47–2h17) |
38 |
34 (89.5%) |
4h17 (2h39–6h02) |
| Missing |
212 |
19 (9.0%) |
0h34 (0h17–1h00) |
216 |
39 (18.1%) |
1h09 (0h39–1h47) |
136 |
102 (75.0%) |
3h00 (2h06–4h26) |
When weighted according to the Geneva population’s
age and sex distribution, median screen time per day was 0h29 (quartile [Q] 1–Q3:
0h14-0h51), 1h14 (Q1–Q3: 0h47–1h48) and 3h18 (Q1–Q3: 2h11–4h43), respectively for
children, preadolescents and adolescents (figure
1).
Prevalence of non-adherence to screen recommendations increased from 7.0% among
children to 20.7% among preadolescents and 78.7% among adolescents. Overall, 61
children (9.1%) were reported to have no screen time, while this was the case for
6 preadolescents (0.8%) and 2 adolescents (0.5%) only.
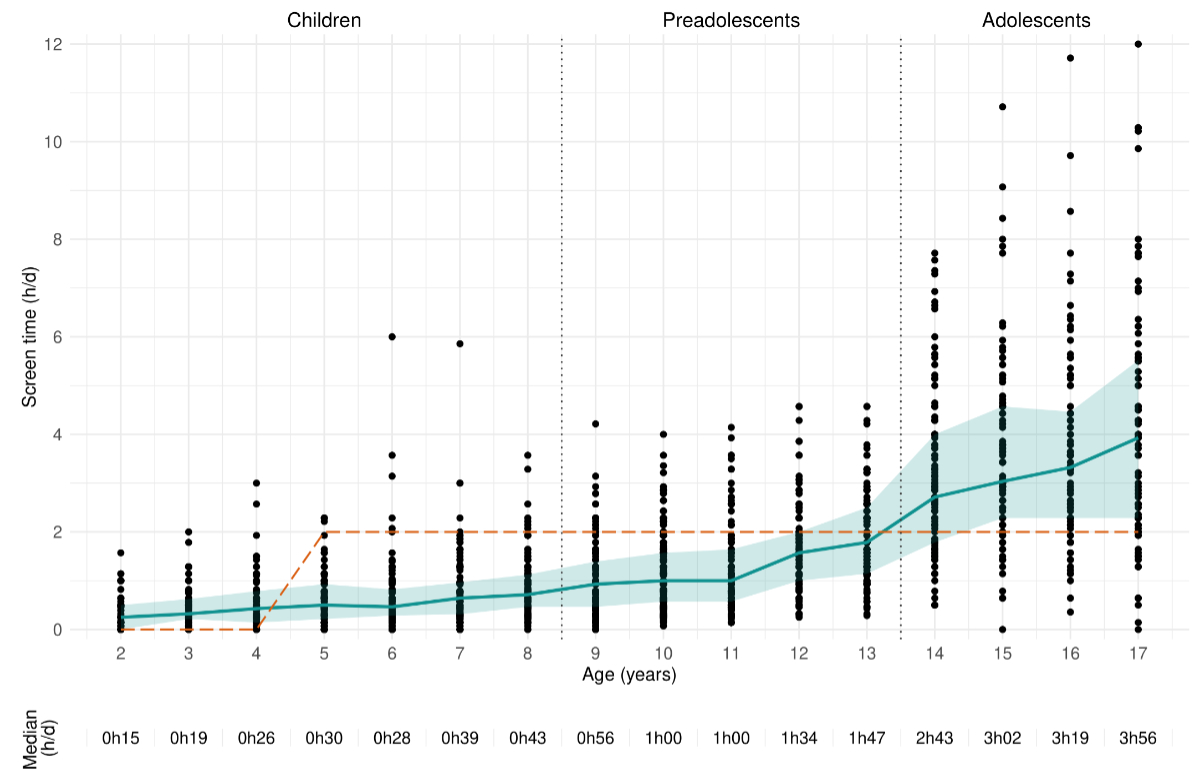
Figure 1Daily recreational screen time according
to age among study participants (n = 1813). The solid line corresponds to median
screen time, the shaded area to the interquartile range and the dashed line to the
threshold for adherence to the recommendation. h/d stands for hours per day.
Determinants of recreational screen time
A lower parental education was associated with
spending an additional 25 minutes per day (95% confidence interval [CI]: 13–37)
on-screen among children, 14 minutes (95% CI: 4–25) among preadolescents and 65
minutes (95% CI: 33–97) among adolescents (figure 2). Compared with children of
highly educated parents, this represented a 95% (95% CI: 53–149%), 29% (95% CI:
13–48%) and 42% (95% CI: 24–63%) higher screen time, respectively (table
S3 in the appendix). On average, preadolescents living in single parent households
had a 22-minute
higher daily screen time (95% CI: 3–42) than their counterparts raised by two parents.
There were no associations with other sociodemographic characteristics.
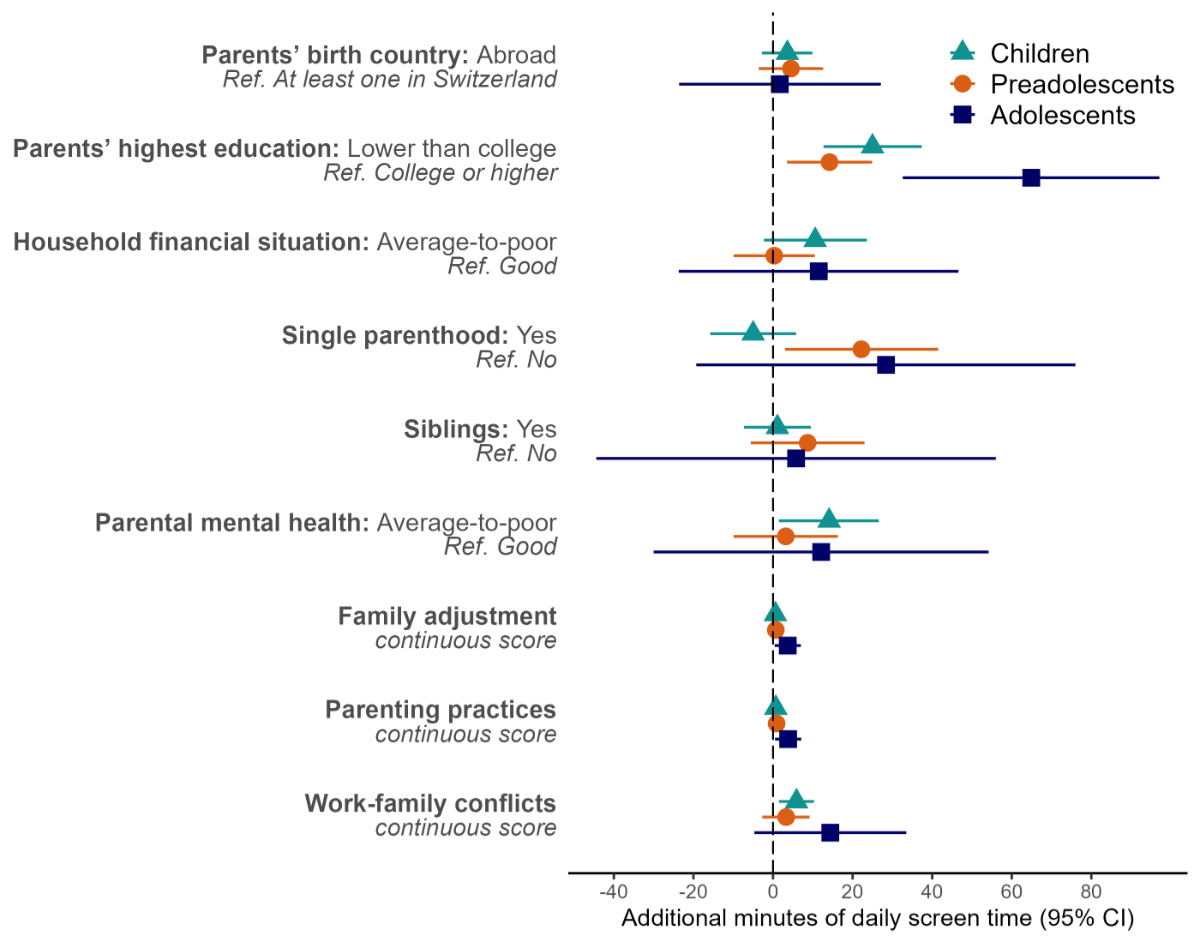
Figure 2Sociodemographic and family determinants
of screen time among children (2–8 years old, n = 674), preadolescents (9–13 years
old, n = 752) and adolescents (14–17 years old, n = 434). Results are additional
minutes of daily screen time with 95% confidence intervals (CI) from age-, sex-
and sociodemographic-adjusted generalised linear models. Higher values of continuous
scores indicate less favourable situations and coefficients correspond to the effect
of a 1-point increase in the scores.
Family characteristics such as average-to-poor
parental mental health (+14 minutes/day; 95% CI: 2–27) or higher work-family conflicts
(+6 minutes/day; 95% CI: 2–10) were also determinants of higher screen time among
children (figure 2, table S3 in the appendix). Furthermore, participants – whether
children,
preadolescents or adolescents – whose parents had less favourable parenting practices
tended to spend more time on-screen. Having siblings was not associated with screen
time.
Similar patterns were observed when examining
determinants of adherence to screen time recommendations and of screen time in percent
difference (table S3).
Association of recreational screen time with health
outcomes one year later
Among preadolescents and adolescents, screen
time was associated with an increased risk of several poor health outcomes after
one year, such as a poor physical health-related quality of life (adjusted relative
risk [aRR]: 1.46; 95% CI: 1.02–2.08 and aRR: 1.15; 95% CI: 0.99–1.35, respectively),
a poor emotional health-related quality of life (aRR: 1.18; 95% CI: 1.03–1.36 and
aRR: 1.04; 95% CI: 0.98–1.10, respectively) and a poor school health-related
quality of life (aRR: 1.14; 95% CI: 0.98–1.33 and aRR: 1.08; 95% CI: 1.02–1.13,
respectively). Conversely, higher screen time seemed related to a good physical
health-related quality of life among children (aRR: 0.56; 95% CI: 0.32–1.00). Each
additional daily hour of screen time was also associated with an 18% (aRR: 1.18;
95% CI: 1.03–1.34) and 15% (aRR: 1.15; 95% CI: 1.02–1.29) increased risk of a poor
social health-related quality of life and of antisocial behaviours among adolescents,
respectively (figure 3).
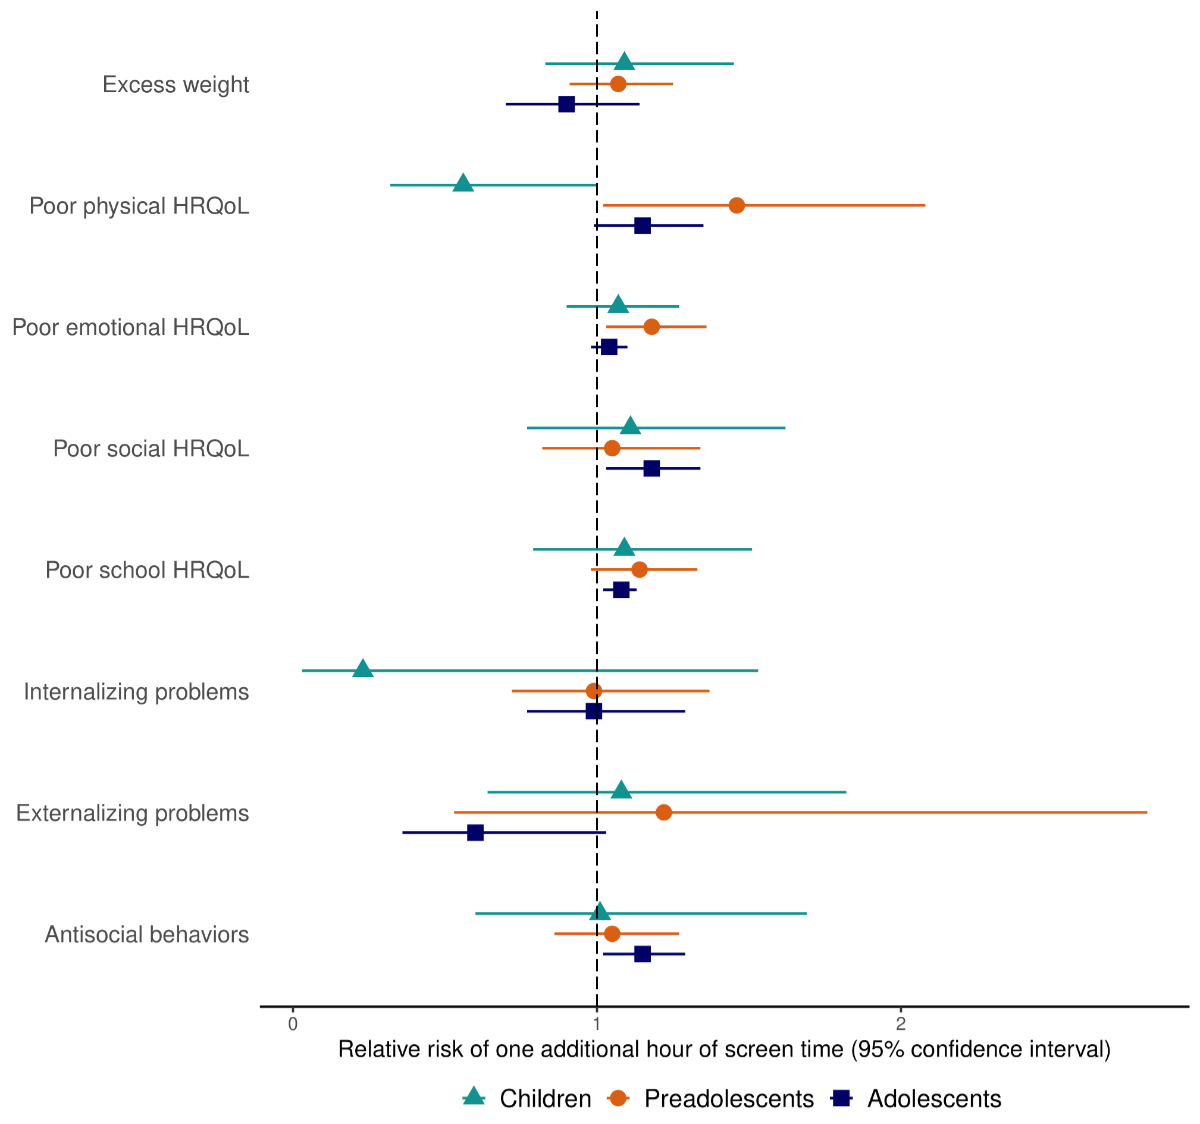
Figure 3Effects of screen time on physical
and psychosocial health after one year among children (2–8 years old, n = 674),
preadolescents (9–13 years old, n = 752) and adolescents (14–17 years old, n = 434).
Results are from generalised linear models following a quasi-Poisson
distribution adjusted for age, sex, sociodemographic characteristics, physical
activity, extracurricular activities and the baseline level of each health
outcome among all participants, and for the number of close friends among preadolescents
and adolescents. HRQoL: health-related quality of life.
Although not significant when adjusting for
the baseline weight status, screen time was associated with a higher risk of excess
weight among children (aRR: 1.43; 95% CI: 1.02–2.01) and preadolescents (aRR: 1.28;
95% CI: 1.06–1.54) even after adjustment for sociodemographic characteristics, physical
and extracurricular activity (table S4 in the appendix). The associations between
screen
time and other health outcomes did not meaningfully change across models (table S4).
Discussion
Screen use was common across all age groups
and strongly increased with age, spanning from a daily median of half an hour among
children to over three hours among adolescents. Determinants of screen time included
a lower parental educational level and less optimal parenting practices in all age
groups. Poorer parental mental health and work-family conflicts were associated
with elevated screen time in children only, while single parenthood was a determinant
in preadolescents only. In turn, higher screen time increased the risk of a poor
physical-, emotional- and school-related quality of life one year later among preadolescents
and adolescents, as well as subsequent social difficulties among adolescents. The
present report expands current research by providing a comprehensive post-pandemic
picture of screen time, related determinants and health consequences from early
childhood to adolescence.
Consistent with pre-pandemic findings [2], screen
time in 2022 was lower in our study taking place in Switzerland than in other European
countries [6, 44]. The observed prevalence of children and preadolescents not meeting
recommendations mirrored Swiss estimates from the second wave of the COVID-19 pandemic,
in winter 2020/21 [5]. It suggests that screen use remained elevated even after
all sanitary restrictions were lifted, as previously found in the Netherlands [6]
and in the United States [7]. On the contrary, the proportion of non-adherent adolescents
was higher in our sample (78% vs 62%) [5]. It could be due to our study relying
on adolescent-reported screen time, whereas in Peralta et al. [5], it was reported
by parents who may have been less aware of the extent of their adolescents’ screen
time.
In line with prior research indicating an association
between disadvantaged socioeconomic circumstances and increased screen time [9,
11], our study found parental education to be a consistent determinant. Interestingly,
its influence was more pronounced than the household’s financial situation, which
did not show an independent effect. It suggests that young individuals’ screen time
may be more closely linked to family social norms and health literacy than purely
economic factors. This aligns with the observation that parenting practices were
associated with screen time in our study and various literature reviews [9, 12].
Parental education may also influence children’s screen time through family structure
and dynamics, which played an additional independent role in our study. As in previous
findings, characteristics such as single parenthood, poor parental mental health
and work-family conflicts were determinants of screen time among children and/or
preadolescents [9]. It might be that they imply lower emotional- and time-availability
of parents to supervise their children’s screen use and engage in alternative activities
with them [45]. Interestingly, these family characteristics were not related to
adolescents’ screen time. It could reflect the decreasing influence of parents in
this age range, paralleled by a growing influence of other non-assessed determinants
such as peer norms [46].
The present findings demonstrate that elevated
screen time is associated with an increased likelihood of subsequent physical and
psychosocial outcomes one year later. Those include diminished physical, emotional
and school functioning among preadolescents and adolescents, as well as heightened
social difficulties among adolescents. It echoes previous reports [16, 18] suggesting
that screen time might affect youth’s psychosocial wellbeing through the displacement
of physical activity, face-to-face interactions and schoolwork, as well as because
of problematic content, cyberbullying and excessive social comparison [19]. Additionally,
as previously observed [14, 16], we found screen use to be related to an increased
risk of excess weight among children and preadolescents. In our analysis, however,
the association was no longer significant when controlling for the baseline weight
status. It suggests that the processes at play might operate over a longer time
frame than the one-year interval between our two measurements [47].
Screen time displayed different health impacts
according to age, affecting psychosocial health in adolescents, excess weight in
children and both in preadolescents. This variability could be attributed to differences
in screen content and context across age groups, leading to differing health consequences.
This finding is in line with a study among children aged 2 to 17 years, which reported
the effect of screen time on psychological wellbeing to be larger in adolescents
than children [48]. Proposed explanations included that mobile phone and internet
use, which are more popular among adolescents than children, may be more detrimental
to mental health than other screen activities [18]. As adolescents with high screen
time may have had elevated use since childhood [49], the heightened effect on adolescents
might also reflect the cumulative exposure to screens. Finally, adolescents are
more likely to possess their own devices [50], which could increase the risk of
problematic use. Also consistent with our results, another longitudinal study spanning
over eight years found that screen time predicted BMI in children aged 6 to 10 years
but not in adolescents, which could be due to a displacement of physical activity
observed among children but not adolescents [49].
Our findings raise concerns for the current
and future health of young individuals since carrying excess weight during childhood
tends to persist into adulthood [51] and because adolescent psychological symptoms
predict later episodes of mental disorder [52]. Strengthening parents’ knowledge
of screen guidelines and of the adverse effects of unhealthy use has been proposed
as an effective way of limiting young people’s screen time [53]. However, beyond
awareness, parental barriers to successfully implement screen rules should also
be considered [45]. For instance, parents frequently mentioned time constraints
as a reason for resorting to screen use to occupy their young children while they
attended to daily chores [54]. Parents of adolescents also expressed doubts about
the practicality of adhering to recommendations they perceived as overly restrictive.
Some admitted to abandoning screen time rules due to failure or conflicts [55].
Therefore, in line with the updated screen guidelines of the American Academy of
Pediatrics [56], carefully reviewing content quality for children and promoting
a moderate and safe screen use for adolescents might be a more pragmatic and acceptable
approach for families than strictly limiting screen time. Structural measures proposing
financially accessible and convenient alternatives to screen use, such as childcare
or extracurricular activities, could also be effective while providing support to
parents [45].
Findings from this analysis should be interpreted
in light of their limitations. First, despite the random selection process, children
with highly educated parents were more likely to participate in our study, as is
frequently the case in epidemiological studies [57]. The observed prevalence of
screen time may thus be underestimated, given its higher occurrence among children
with less educated parents. Second, data reported by referent parents and adolescents
could have been subject to measurement errors, especially for screen time [58].
Third, the one-year follow-up assessment may have been too short to observe more
substantial effects of screen time on some health outcomes under study, particularly
weight. Further follow-ups within the scope of this longitudinal study will provide
more insights. Finally, statistical power was limited due to the age stratification,
which reduces the certainty around some estimates, but does not impact the interpretation
of observed associations. Strengths included the random selection of participants
covering a large age range, the longitudinal design as well as the examination of
multiple physical and psychosocial health outcomes measured with validated scales.
Conclusion
While almost all children engage with screens,
those from socially disadvantaged backgrounds and with strained families seem to
face a heightened risk of prolonged screen time. The implications for their physical
and psychosocial wellbeing are concerning, highlighting the need for interventions
to promote safe screen usage and for the provision of accessible alternatives. Finally,
research and monitoring are essential to deepen our understanding of the mechanisms
driving these health effects and to adapt to the evolving patterns of screen use.
Availability of data and materials
The dataset
used during the current study is available from the corresponding author on reasonable
request.
Acknowledgments
We are grateful to the staff of the Unit of
Population Epidemiology of the Division of Primary Care Medicine of University Hospitals
of Geneva, as well as to all participants whose contributions were invaluable to
the study.
Authors’ contributions: All authors contributed to study conception and design.
Material preparation and data collection were performed by Viviane Richard, Roxane
Dumont, Elsa Lorthe, Andrea Loizeau, Hélène Baysson, María-Eugenia Zaballa, Julien
Lamour and Silvia Stringhini. Rémy P. Barbe, Klara M. Posfay-Barbe, Idris Guessous
and Silvia Stringhini supervised the study. Analyses were performed by Viviane Richard
who also wrote the first draft of the manuscript. All authors critically revised
the previous versions of the manuscript. All authors read and approved the final
manuscript.
Generative AI and AI-assisted technologies in the
writing process: During the preparation of this work, the authors
used ChatGPT-3.5 in order to improve readability and language. After using this
tool, the authors reviewed and edited the content as needed and take full responsibility
for the content of the publication.
SEROCoV-KIDS study group: Andrew S. Azman, Antoine
Bal, Rémy P. Barbe, Hélène Baysson, Aminata R. Bouchet, Paola D’Ippolito, Roxane
Dumont, Nacira El Merjani, Francesco Pennacchio, Natalie Francioli, Idris Guessous,
Séverine Harnal, Julien Lamour, Arnaud G L’Huillier, Andrea Loizeau, Elsa Lorthe,
Chantal Martinez, Shannon Mechoullam, Mayssam Nehme, Klara M. Posfay-Barbe, Géraldine
Poulain, Caroline Pugin, Nick Pullen, Viviane Richard, Deborah Rochat, Khadija Samir,
Stephanie Schrempft, Silvia Stringhini, Stéphanie Testini, Deborah Urrutia Rivas,
Anshu Uppal, Charlotte Verolet, Jennifer Villers, Guillemette Violot, María-Eugenia
Zaballa.
Viviane
Richard
Unit of
Population Epidemiology
Division of
Primary Care Medicine
Geneva
University Hospitals
Rue
Jean-Violette 29
CH-1205 Geneva
vivianeadissa.richard[at]hug.ch
References
1. Reid Chassiakos YL, Radesky J, Christakis D, Moreno MA, Cross C, Hill D, et al.; Council
on communications and media. Children and Adolescents and Digital Media. Pediatrics.
2016 Nov;138(5):e20162593. doi: https://doi.org/10.1542/peds.2016-2593
2. Ghekiere A, Van Cauwenberg J, Vandendriessche A, Inchley J, Gaspar de Matos M, Borraccino A,
et al. Trends in sleeping difficulties among European adolescents: are these associated
with physical inactivity and excessive screen time? Int J Public Health. 2019 May;64(4):487–98.
doi: https://doi.org/10.1007/s00038-018-1188-1
3. Delgrande Jordan M. Les écrans, Internet et les réseaux sociaux - Résultats de l’étude
« Health Behaviour in Schoolaged Children » (HBSC) 2018 (Rapport de recherche No 114)
2020. Available from: https://www.hbsc.ch/pdf/hbsc_bibliographie_373.pdf
4. Madigan S, Eirich R, Pador P, McArthur BA, Neville RD. Assessment of Changes in Child
and Adolescent Screen Time During the COVID-19 Pandemic: A Systematic Review and Meta-analysis.
JAMA Pediatr. 2022 Dec;176(12):1188–98. doi: https://doi.org/10.1001/jamapediatrics.2022.4116
5. Peralta GP, Camerini AL, Haile SR, Kahlert CR, Lorthe E, Marciano L, et al. Lifestyle
Behaviours of Children and Adolescents During the First Two Waves of the COVID-19
Pandemic in Switzerland and Their Relation to Well-Being: An Observational Study.
Int J Public Health. 2022 Sep;67:1604978. doi: https://doi.org/10.3389/ijph.2022.1604978
6. de Bruijn AG, Te Wierike SC, Mombarg R. Trends in and relations between children’s
health-related behaviors pre-, mid- and post-Covid. Eur J Public Health. 2023 Apr;33(2):196–201.
doi: https://doi.org/10.1093/eurpub/ckad007
7. Hedderson MM, Bekelman TA, Li M, Knapp EA, Palmore M, Dong Y, et al.; Environmental
Influences on Child Health Outcomes Program. Trends in Screen Time Use Among Children
During the COVID-19 Pandemic, July 2019 Through August 2021. JAMA Netw Open. 2023 Feb;6(2):e2256157–2256157.
doi: https://doi.org/10.1001/jamanetworkopen.2022.56157
8. Hassinger-Das B, Brennan S, Dore RA, Golinkoff RM, Hirsh-Pasek K. Children and Screens.
Annu Rev Dev Psychol. 2020;2(1):69–92. doi: https://doi.org/10.1146/annurev-devpsych-060320-095612
9. Hoyos Cillero I, Jago R. Systematic review of correlates of screen-viewing among young
children. Prev Med. 2010 Jul;51(1):3–10. doi: https://doi.org/10.1016/j.ypmed.2010.04.012
10. Stierlin AS, De Lepeleere S, Cardon G, Dargent-Molina P, Hoffmann B, Murphy MH, et
al.; DEDIPAC consortium. A systematic review of determinants of sedentary behaviour
in youth: a DEDIPAC-study. Int J Behav Nutr Phys Act. 2015 Oct;12(1):133. doi: https://doi.org/10.1186/s12966-015-0291-4
11. Mielke GI, Brown WJ, Nunes BP, Silva IC, Hallal PC. Socioeconomic Correlates of Sedentary
Behavior in Adolescents: Systematic Review and Meta-Analysis. Sports Med. 2017 Jan;47(1):61–75.
doi: https://doi.org/10.1007/s40279-016-0555-4
12. Veldman SL, Altenburg TM, Chinapaw MJ, Gubbels JS. Correlates of screen time in the
early years (0-5 years): A systematic review. Prev Med Rep. 2023 Apr;33:102214. doi: https://doi.org/10.1016/j.pmedr.2023.102214
13. Musić Milanović S, Buoncristiano M, Križan H, Rathmes G, Williams J, Hyska J, et al. Socioeconomic
disparities in physical activity, sedentary behavior and sleep patterns among 6- to
9-year-old children from 24 countries in the WHO European region. Obes Rev. 2021 Nov;22(S6 Suppl
6):e13209. doi: https://doi.org/10.1111/obr.13209
14. Fang K, Mu M, Liu K, He Y. Screen time and childhood overweight/obesity: A systematic
review and meta-analysis. Child Care Health Dev. 2019 Sep;45(5):744–53. doi: https://doi.org/10.1111/cch.12701
15. Zhang T, Lu G, Wu XY. Associations between physical activity, sedentary behaviour
and self-rated health among the general population of children and adolescents: a
systematic review and meta-analysis. BMC Public Health. 2020 Sep;20(1):1343. doi: https://doi.org/10.1186/s12889-020-09447-1
16. Stiglic N, Viner RM. Effects of screentime on the health and well-being of children
and adolescents: a systematic review of reviews. BMJ Open. 2019 Jan;9(1):e023191.
doi: https://doi.org/10.1136/bmjopen-2018-023191
17. Viner RM, Gireesh A, Stiglic N, Hudson LD, Goddings AL, Ward JL, et al. Roles of cyberbullying,
sleep, and physical activity in mediating the effects of social media use on mental
health and wellbeing among young people in England: a secondary analysis of longitudinal
data. Lancet Child Adolesc Health. 2019 Oct;3(10):685–96. doi: https://doi.org/10.1016/S2352-4642(19)30186-5
18. Tang S, Werner-Seidler A, Torok M, Mackinnon AJ, Christensen H. The relationship between
screen time and mental health in young people: A systematic review of longitudinal
studies. Clin Psychol Rev. 2021 Jun;86:102021. doi: https://doi.org/10.1016/j.cpr.2021.102021
19. Brown JD, Bobkowski PS. Older and Newer Media: Patterns of Use and Effects on Adolescents’
Health and Well-Being. J Res Adolesc. 2011;21(1):95–113. doi: https://doi.org/10.1111/j.1532-7795.2010.00717.x
20. Stringhini S, Wisniak A, Piumatti G, Azman AS, Lauer SA, Baysson H, et al. Seroprevalence
of anti-SARS-CoV-2 IgG antibodies in Geneva, Switzerland (SEROCoV-POP): a population-based
study. Lancet. 2020 Aug;396(10247):313–9. doi: https://doi.org/10.1016/S0140-6736(20)31304-0
21. Stringhini S, Zaballa ME, Perez-Saez J, Pullen N, de Mestral C, Picazio A, et al.;
Specchio-COVID19 Study Group. Seroprevalence of anti-SARS-CoV-2 antibodies after the
second pandemic peak. Lancet Infect Dis. 2021 May;21(5):600–1. doi: https://doi.org/10.1016/S1473-3099(21)00054-2
22. Stringhini S, Zaballa ME, Pullen N, Perez-Saez J, de Mestral C, Loizeau AJ, et al.;
Specchio-COVID19 study group. Seroprevalence of anti-SARS-CoV-2 antibodies 6 months
into the vaccination campaign in Geneva, Switzerland, 1 June to 7 July 2021. Euro
Surveill. 2021 Oct;26(43):2100830. doi: https://doi.org/10.2807/1560-7917.ES.2021.26.43.2100830
23. Zaballa ME, Perez-Saez J, de Mestral C, Pullen N, Lamour J, Turelli P, et al.; Specchio-COVID19
study group. Seroprevalence of anti-SARS-CoV-2 antibodies and cross-variant neutralization
capacity after the Omicron BA.2 wave in Geneva, Switzerland: a population-based study.
Lancet Reg Health Eur. 2023 Jan;24:100547. doi: https://doi.org/10.1016/j.lanepe.2022.100547
24. Baysson H, Pennachio F, Wisniak A, Zabella ME, Pullen N, Collombet P, et al.; Specchio-COVID19
study group. Specchio-COVID19 cohort study: a longitudinal follow-up of SARS-CoV-2
serosurvey participants in the canton of Geneva, Switzerland. BMJ Open. 2022 Jan;12(1):e055515.
doi: https://doi.org/10.1136/bmjopen-2021-055515
25. World Health Organization. Guidelines on physical activity, sedentary behaviour and
sleep for children under 5 years of age 2019. Available from: https://www.who.int/publications/i/item/9789241550536
26. Tremblay MS, Carson V, Chaput JP, Connor Gorber S, Dinh T, Duggan M, et al. Canadian
24-Hour Movement Guidelines for Children and Youth: An Integration of Physical Activity,
Sedentary Behaviour, and Sleep1. Appl Physiol Nutr Metab. 2016;41 6 (Suppl. 3):S311–27.
doi: https://doi.org/10.1139/apnm-2016-0151
27. Australian Government Department of Health and Aged Care. Physical activity and exercise
guidelines for children and young people (5 to 17 years). Available from: https://www.health.gov.au/topics/physical-activity-and-exercise/physical-activity-and-exercise-guidelines-for-all-australians/for-children-and-young-people-5-to-17-years
28. Sanders MR, Morawska A, Haslam DM, Filus A, Fletcher R. Parenting and Family Adjustment
Scales (PAFAS): validation of a brief parent-report measure for use in assessment
of parenting skills and family relationships. Child Psychiatry Hum Dev. 2014 Jun;45(3):255–72.
doi: https://doi.org/10.1007/s10578-013-0397-3
29. Teague SJ, Newman LK, Tonge BJ, Gray KM; MHYPeDD team. Caregiver Mental Health, Parenting
Practices, and Perceptions of Child Attachment in Children with Autism Spectrum Disorder.
J Autism Dev Disord. 2018 Aug;48(8):2642–52. doi: https://doi.org/10.1007/s10803-018-3517-x
30. Breyer B, Bluemke M. Work-Family Conflict Scale (ISSP). ZIS - The Collection Items
and Scales for the Social Sciences; 2016.
31. Schumacher D, Borghi E, Polonsky J, et al. Computation of the WHO Child Growth Standards 2023.
32. Schumacher D, Borghi E, Gatica-Domínguez G, et al. Computation of the WHO 2007 References
for School-Age Children and Adolescents (5 to 19 Years) 2021.
33. de Onis M, Lobstein T. Defining obesity risk status in the general childhood population:
which cut-offs should we use? Int J Pediatr Obes. 2010 Dec;5(6):458–60. doi: https://doi.org/10.3109/17477161003615583
34. Chan KS, Mangione-Smith R, Burwinkle TM, Rosen M, Varni JW. The PedsQL: reliability
and validity of the short-form generic core scales and Asthma Module. Med Care. 2005 Mar;43(3):256–65.
doi: https://doi.org/10.1097/00005650-200503000-00008
35. Varni JW, Burwinkle TM, Seid M, Skarr D. The PedsQL 4.0 as a pediatric population
health measure: feasibility, reliability, and validity. Ambul Pediatr. 2003;3(6):329–41.
doi: https://doi.org/10.1367/1539-4409(2003)003<0329:TPAAPP>2.0.CO;2
36. Shojaei T, Wazana A, Pitrou I, Kovess V. The strengths and difficulties questionnaire:
validation study in French school-aged children and cross-cultural comparisons. Soc
Psychiatry Psychiatr Epidemiol. 2009 Sep;44(9):740–7. doi: https://doi.org/10.1007/s00127-008-0489-8
37. Goodman A, Lamping DL, Ploubidis GB. When to use broader internalising and externalising
subscales instead of the hypothesised five subscales on the Strengths and Difficulties
Questionnaire (SDQ): data from British parents, teachers and children. J Abnorm Child
Psychol. 2010 Nov;38(8):1179–91. doi: https://doi.org/10.1007/s10802-010-9434-x
38. OCSTAT - Statistique cantonale de la population. Pyramide des âges de la population
résidante du canton de Genève, selon l’origine et le sexe, à fin 2021 2022.
39. Westreich D, Greenland S. The table 2 fallacy: presenting and interpreting confounder
and modifier coefficients. Am J Epidemiol. 2013 Feb;177(4):292–8. doi: https://doi.org/10.1093/aje/kws412
40. Lumley T. The survey Package for R, 15 Years on. Surv Stat. 2023;88:96–104.
41. Seaman SR, White IR, Copas AJ, Li L. Combining multiple imputation and inverse-probability
weighting. Biometrics. 2012 Mar;68(1):129–37. doi: https://doi.org/10.1111/j.1541-0420.2011.01666.x
42. van Buuren S, Groothuis-Oudshoorn K. mice: Multivariate Imputation by Chained Equations
in R. J Stat Softw. 2011;45(3):1–67. doi: https://doi.org/10.18637/jss.v045.i03
43. Wickham H, Averick M, Bryan J, Chang W, McGowan L, François R, et al. Welcome to the
Tidyverse. J Open Source Softw. 2019;4(43):1686. doi: https://doi.org/10.21105/joss.01686
44. Salway R, Walker R, Sansum K, House D, Emm-Collison L, Reid T, et al. Screen-viewing
behaviours of children before and after the 2020-21 COVID-19 lockdowns in the UK:
a mixed methods study. BMC Public Health. 2023 Jan;23(1):116. doi: https://doi.org/10.1186/s12889-023-14976-6
45. Hartshorne JK, Huang YT, Lucio Paredes PM, Oppenheimer K, Robbins PT, Velasco MD.
Screen time as an index of family distress. Curr Res Behav Sci. 2021;2:100023. doi: https://doi.org/10.1016/j.crbeha.2021.100023
46. Rice EL, Klein WM. Interactions among perceived norms and attitudes about health-related
behaviors in U.S. adolescents. Health Psychol. 2019 Mar;38(3):268–75. doi: https://doi.org/10.1037/hea0000722
47. Biddle SJ, García Bengoechea E, Pedisic Z, Bennie J, Vergeer I, Wiesner G. Screen
Time, Other Sedentary Behaviours, and Obesity Risk in Adults: A Review of Reviews.
Curr Obes Rep. 2017 Jun;6(2):134–47. doi: https://doi.org/10.1007/s13679-017-0256-9
48. Twenge JM, Campbell WK. Associations between screen time and lower psychological well-being
among children and adolescents: evidence from a population-based study. Prev Med Rep.
2018 Oct;12:271–83. doi: https://doi.org/10.1016/j.pmedr.2018.10.003
49. Hands BP, Chivers PT, Parker HE, Beilin L, Kendall G, Larkin D. The associations between
physical activity, screen time and weight from 6 to 14 yrs: the Raine Study. J Sci
Med Sport. 2011 Sep;14(5):397–403. doi: https://doi.org/10.1016/j.jsams.2011.03.011
50. Rosen LD, Lim AF, Felt J, Carrier LM, Cheever NA, Lara-Ruiz JM, et al. Media and technology
use predicts ill-being among children, preteens and teenagers independent of the negative
health impacts of exercise and eating habits. Comput Human Behav. 2014 Jun;35:364–75.
doi: https://doi.org/10.1016/j.chb.2014.01.036
51. Singh AS, Mulder C, Twisk JW, van Mechelen W, Chinapaw MJ. Tracking of childhood overweight
into adulthood: a systematic review of the literature. Obes Rev. 2008 Sep;9(5):474–88.
doi: https://doi.org/10.1111/j.1467-789X.2008.00475.x
52. Patton GC, Coffey C, Romaniuk H, Mackinnon A, Carlin JB, Degenhardt L, et al. The
prognosis of common mental disorders in adolescents: a 14-year prospective cohort
study. Lancet. 2014 Apr;383(9926):1404–11. doi: https://doi.org/10.1016/S0140-6736(13)62116-9
53. Hinkley T, Carson V, Kalomakaefu K, Brown H. What mums think matters: A mediating
model of maternal perceptions of the impact of screen time on preschoolers’ actual
screen time. Prev Med Rep. 2017 Apr;6:339–45. doi: https://doi.org/10.1016/j.pmedr.2017.04.015
54. Carson V, Clark M, Berry T, Holt NL, Latimer-Cheung AE. A qualitative examination
of the perceptions of parents on the Canadian Sedentary Behaviour Guidelines for the
early years. Int J Behav Nutr Phys Act. 2014 May;11(1):65. doi: https://doi.org/10.1186/1479-5868-11-65
55. Hattersley LA, Shrewsbury VA, King LA, Howlett SA, Hardy LL, Baur LA. Adolescent-parent
interactions and attitudes around screen time and sugary drink consumption: a qualitative
study. Int J Behav Nutr Phys Act. 2009 Sep;6(1):61. doi: https://doi.org/10.1186/1479-5868-6-61
56. AAP Council on communications and media. Media Use in School-Aged Children and Adolescents.
Pediatrics. 2016;138(5):e20162592. doi: https://doi.org/10.1542/peds.2016-2592
57. Galea S, Tracy M. Participation rates in epidemiologic studies. Ann Epidemiol. 2007 Sep;17(9):643–53.
doi: https://doi.org/10.1016/j.annepidem.2007.03.013
58. Parry DA, Davidson BI, Sewall CJ, Fisher JT, Mieczkowski H, Quintana DS. A systematic
review and meta-analysis of discrepancies between logged and self-reported digital
media use. Nat Hum Behav. 2021 Nov;5(11):1535–47. doi: https://doi.org/10.1038/s41562-021-01117-5
Appendix
The appendix is available in the pdf version of the article at https://doi.org/10.57187/s.4247.