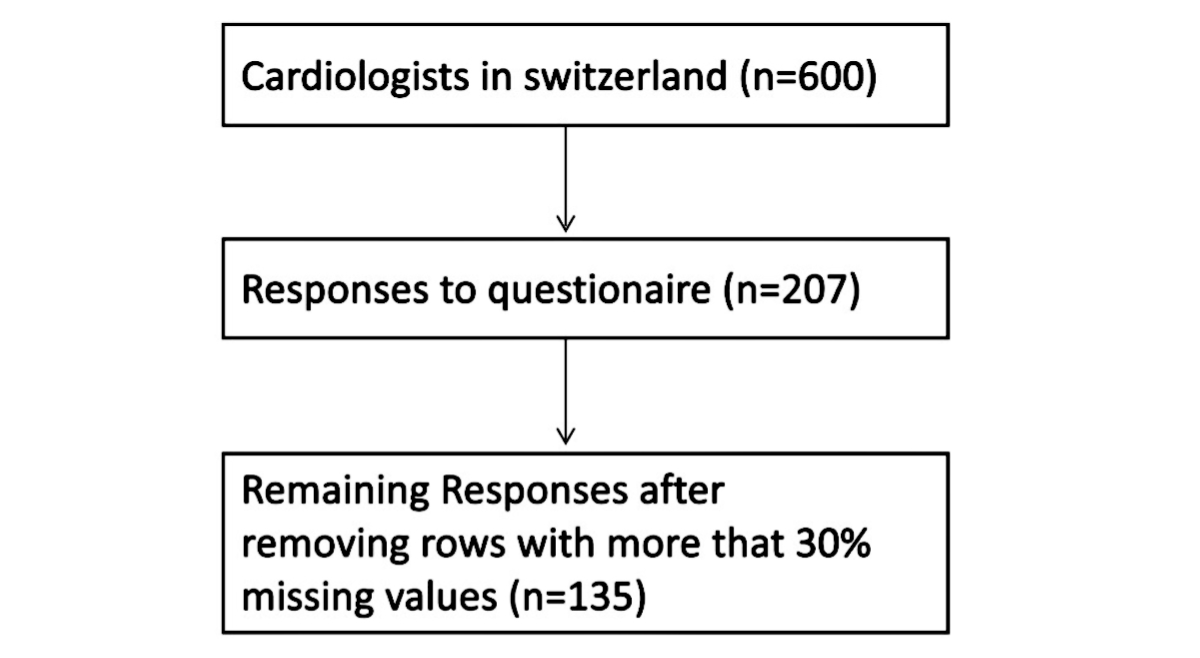
Figure 1Participant flowchart.
DOI: https://doi.org/https://doi.org/10.57187/s.4178
Direct Observation of Procedural Skills
Mini Clinical Evaluation Exercise
Currently, medical training in Switzerland is transitioning from a time-based approach to a competency-based approach. To evaluate the intended and unintended outcomes of this reform, it is mandatory to use robust measuring instruments. The importance of validated instruments for assessing quality in specific medical contexts has been demonstrated in previous studies [1, 2]. In this manuscript, we describe our use and investigation of the SwissSETQ (Swiss Supervisor Evaluation and Training Questionnaire), which was designed to assess the quality of supervision in clinical training settings [3]. The SwissSETQ is an adaptation of the SETQsmart, an internationally established instrument to assess the quality of supervision in clinical training settings [4].
The SETQsmart was developed by Lombarts et al. in 2016 in an international study with anaesthesiology faculty and residents for formative assessment of anaesthesiology teaching, based on earlier versions of similar instruments. The SETQsmart was intended to assess the quality of supervision in clinical training settings and to be used by both trainees and supervisors [4].
The SwissSETQ was developed by Breckwoldt et al. in 2022 to integrate aspects of the CanMEDS 2015 update and the concept of Entrustable Professional Activities [3]. CanMEDS is an internationally recognized competency framework developed by the Royal College of Physicians and Surgeons of Canada. It outlines the essential roles physicians must fulfill to provide high-quality care, including medical expert, communicator, collaborator, leader, health advocate, scholar, and professional.
The SwissSETQ aims to facilitate constructive feedback, enabling supervisors to enhance their professional development and improve their supervisory practices. It is designed to gather structured feedback from trainees about their supervisors, focusing on seven domains, namely Support of learning, Attitude towards residents, Teaching tailored to trainees’ needs, Evaluation of trainees’ knowledge and skills, Feedback, Professional practice management and Role modelling. These domains had similarly been used in the SETQsmart. Factor analysis of the SwissSETQ items identified four factors: Individual instruction (i = 16 items), Evaluation of a trainee’s performance (i = 10 items), Teaching professionalism (i = 5 items) and Entrustment decision (i = 2 items).
As the SwissSETQ was only published in 2022, its application has not yet been very well investigated. To our knowledge, the SwissSETQ has only been assessed when used in German. Additionally, the SwissSETQ has so far only been examined from the trainees’ perspective [3]. This means that, unlike the SETQsmart, there is no supervisor self-assessment version of the SwissSETQ. Additionally, previous validation was limited to the specialty of anaesthesiology, and the level of teaching expertise of supervisors was not assessed. Our study aims to close these gaps by adapting and validating an English version specifically for supervisors.
Switzerland has four official languages – German, French, Italian and Romansh – which are actively maintained. However, Romansh does not play a role in the field of medical education. Translating the SwissSETQ into English is important because English serves as a common language for all language regions in Switzerland, facilitating standardised training and supervision. Switzerland’s integrated healthcare system often requires professionals to work across different linguistic regions. An English version of the SwissSETQ ensures consistent evaluation and improvement of supervision quality nationwide, supporting a unified national framework for supervisor assessment. The translation aims to improve clarity and cultural relevance of the instrument for users without losing the Swiss context. Adapting the questionnaire for supervisors ensures that it addresses their specific roles and responsibilities, which ultimately supports professional development and improves the quality of clinical education in Switzerland.
Our study has two main objectives: first, to validate the psychometric properties of the adapted English version of the SwissSETQ; and second, to develop a robust self-assessment instrument for supervisors. Specifically, we aim:
We aim to enhance the applicability of the SwissSETQ by developing a tool that can be used consistently across all linguistic regions in Switzerland and by providing a supervisor-specific version to support standardised self-assessment in medical training. Our adapted SwissSETQ version is designed to allow supervisors to identify areas for improvement in their teaching and supervisory behaviours.
The SwissSETQ questionnaire [3] was originally designed to be used by residents and was only available in German. To create a version for supervisors in different Swiss language regions, we translated the SwissSETQ questionnaire into English. We set out to honour the Swiss context and local language usage by starting with the SwissSETQ questionnaire rather than the original English-language SETQsmart questionnaire [4]. Next, we adjusted the grammar to reflect the supervisor’s perspective. This two-step adaptation process is exemplified as follows: the original German item “[…] ermöglicht es mir, mich aktiv in Diskussionen einzubringen” was translated as “[…] encourages me to actively participate in discussions” and then grammatically adjusted to “I encourage residents to actively participate in discussions”. Response options were a 7-point Likert scale with 1 = fully disagree, 2 = disagree, 3 = partly disagree, 4 = neutral, 5 = partly agree, 6 = agree, 7 = fully agree, in line with the SwissSETQ.
To investigate the validity of the questionnaire, we sought to recruit participants representing different Swiss regions and hospital categories, as detailed below. The questionnaire was provided using SoSci Survey [5], a professional online survey tool, and distributed among cardiologists in Switzerland. Participation was voluntary and based on informed consent. Participants were invited via email. One week after the initial invitation, a second email was sent as a reminder. A maximum of two reminders were sent. No personal data were requested. This study was not registered beforehand, therefore no study protocol is available.
The use of the supervisor-specific self-assessment tool was part of a study investigating the teaching culture in Swiss cardiology training sites, with the aim of evaluating supervisory qualities on an individual level as one important part of the teaching culture. We recruited supervisors from all cardiology training sites, which covers German-, French- and Italian-speaking Swiss regions and from different categories of training sites. Data were collected between March and April 2024.
Eligibility for this cross-sectional study was open to supervisors in the field of cardiology in a hospital of category A to D. Category A offers the most comprehensive training, typically in large university hospitals; category B provides extensive but slightly less comprehensive training; category C offers training in smaller hospitals; and category D focuses primarily on medical practices. The available options for the supervisor’s function were: senior physician, head physician, chief physician or doctor in practice. Participants selected their level of employment from a dropdown menu with predefined options in 10% increments, ranging from 10% to 100%. For all questions, respondents could choose the option “Other” for categories not covered or they could also actively choose not to respond.
The questionnaire comprised seven sociodemographic variables, predominantly characterising the professional role of the participant (as detailed in the previous section). The SwissSETQ consists of 34 items, which aim to address the domains of Individual instruction, Evaluation of a trainee’s performance, Teaching professionalism and Entrustment decision. Each item is answered on a 7-point Likert scale.
The minimum sample size for conducting factor analysis under favourable conditions (e.g. communalities >0.60) is considered n = 50 [6]. When referring to the subject-to-variables rule 5-10 are recommended; however the latter is irretrievably linked to factor loadings, communalities, respectively. Given these considerations, a sample size of at least n = 100 is considered sufficient for exploratory factor analysis, although a larger sample size would be better [7–9].
The statistical analysis consisted of three sections. The first was merely descriptive; the second, exploratory factor analysis (EFA), belongs to classical test theory and is used to identify latent constructs such as the evaluation of a trainee’s performance. To reliably measure a latent construct, several items should load in the same direction, as indicated by the correlation or covariance matrix on which exploratory factor analysis (EFA) is based. The third section comes from probabilistic test theory and enables evaluation of response options (also called item response theory). In particular we employ the partial credit model (PCM) to scrutinise whether the responses to the items represent an ordered, linear scale as hypothesised by classical test theory (X = T + E). Although this assumption represents the basis for any classical test theoretical computation such as exploratory factor analysis and is considered a main indicator for scalability, this psychometric assumption is hardly ever tested [10, 11]. By ensuring scalability through the use of item response theory methodology, we enable subsequent validity assessments.
Statistical analysis was performed with the software R (version 4.2.3) [12] with RStudio 2024.04.2. The following packages were used: The R Base Package v. 4.4.1, A Grammar of Data Manipulation v. 1.1.4 [13], Procedures for Psychological, Psychometric, and Personality Research v. 2.4.6.26 [14], S3 Infrastructure for Regular and Irregular Time Series (Z’s Ordered Observations) v. 1.8-12 [15], ‘ggplot2’ Based Publication Ready Plots v. 0.6.0 [16], Miscellaneous Functions ‘T. Yanagida’ v. 0.6.8 [17], Extended Rasch Modeling v. 1.0-6 [18], and their dependencies. Data cleaning focused on missing values, with rows more than 30% missing being removed [19]. Missing values were treated as missing; no imputation method was employed. Descriptive statistics are reported as the mean (M), standard deviation (SD), median (Md), minimum (min) and maximum (max) value as well as skew. Skewness between −2 to 2 indicates that data were roughly symmetrical [20]. Response rate is computed as the total number of respondents in relation to the total sample size.
Psychometric properties were evaluated by conducting a maximum likelihood exploratory factor analysis with promax rotation [21]. Bartlett’s test of sphericity and the Kaiser-Meyer-Olkin (KMO) coefficient were used to evaluate whether distributions could be subject to exploratory factor analysis. The Kaiser-Meyer-Olkin coefficient tests whether there is shared variance among items. Bartlett’s test of sphericity tests the null hypothesis that items are not correlated [22]. The Scree-plot and parallel analysis is investigated to obtain a hinge of factors to extract. To resemble a clear factor structure loadings were supposed to be greater than 0.4 with few double loadings, communalities (λ) should range between 0.25 and 0.4, with communalities >0.7 being considered excellent [21, 23]. Factors with fewer than three items were discarded. Scales extracted from factor analysis should meet the following criteria [24]: Total part-whole correlation (rit) greater than 0.3, standardised Cronbach’s α greater than 0.7 and α if deleted should not drop compared to the overall Cronbach’s α value. The percentage of overall variance (σ2 cumulative [25]) accounted for by factors should not be less than 40%.
As response range was restricted for multiple items, the PCM was computed to evaluate item thresholds [26]. Item thresholds represent the six gaps between response options 1 to 7; they should follow an ascending order [27]. An ascending order implies that response options rise continuously from left (fully disagree) to right (fully agree). If this axiom is violated, a refinement of response options based on collapsing adjacent categories will be suggested. Exploratory comparisons between groups are analysed by computing Analysis of Variance (ANOVA) and post hoc application of Tukey’s Honest Significant Difference (HSD) [28, 29].
The study does not fall under the Swiss Human Research Act, hence no ethical approval was needed.
Of approximately 600 cardiology supervisors in Switzerland, 207 responded. After excluding rows which had more than 30% missing values, 135 cases remained (as shown in figure 1). Of note, the response rate does not necessarily represent response quality since several factors may differentially affect online responding behaviour [31, 32].
Figure 1Participant flowchart.
The demographics of the sample are shown in table 1. A comparison of sex showed that 23% of women work at 70% or less employment, compared to only 5% of male respondents. For all but four participants, medicine was their first educational path.
Table 1Demographics of the sample (n = 135).
| Age, mean (standard deviation) | 48.95 (7.89) | |
| Female, n (%) | 31 (23%) | |
| Category of teaching centre, n (%) * | A | 68 (50%) |
| B | 25 (19%) | |
| C | 16 (12%) | |
| D | 23 (17%) | |
| I prefer not to respond | 3 (4%) | |
| Language region, n (%) | German | 96 (71%) |
| French | 23 (17%) | |
| Italian | 7 (5%) | |
| I prefer not to respond | 9 (6%) | |
| Function as supervisor, n (%) | Senior physician (Oberärzt:in, Chef.fe de clinique) | 31 (23%) |
| Head physician (Leitende Ärzt:in, Médecin adjoint.e/Médicin associé.e) | 45 (33%) | |
| Chief physician (Chefärzt:in, Médecin chef.fe) | 24 (18%) | |
| Doctor in practice (Niedergelassene Kardiolog:in, Cardiologue en cabinet) | 29 (14%) | |
| Other | 6 (4%) | |
| Level of employment, n (%) | ≤70% | 12 (9%) |
| 80% | 18 (13%) | |
| 90% | 13 (10%) | |
| 100% | 87 (64%) | |
| Response to question “Do you have any medical education training?” (more than one answer possible), n ** | No | 14 |
| No, but planned | 1 | |
| “Teach the Teachers” classes | 12 | |
| Didactics course | 25 | |
| Privat Dozent (PD) | 3 | |
| Klinischer Dozent (KD) | 3 | |
| Master in Medical Education (MME) | 4 | |
* In Switzerland, medical training centres are classified into categories A to D. Category A offers the most comprehensive training, typically in large university hospitals; Category B provides extensive but slightly less comprehensive training; Category C offers training in smaller hospitals; and Category D focuses on specialised training in specific areas.
** Totals below 100% and over 100% are due to multiple answers and “Prefer not to respond” answers.
We used a 7-point Likert scale with options from fully disagree (left) to fully agree (right). Mean values for the 34-item questionnaire ranged from 3.13 to 6.60, indicating partial disagreement to total agreement; see table 2. The largest standard deviation was observed for item SSQ27 (“I regularly perform high quality workplace-based assessments with residents (e.g., Mini Clinical Evaluation Exercise [Mini-CEX], Direct Observation of Procedural Skills [DOPS], etc.)” (SD = 1.80), indicating the most heterogeneous responses, compared to item SSQ25 (“I behave respectfully towards residents”), which had the smallest standard deviation (SD = 0.64). Although all items were left-skewed, they remained within a tolerable range. Items about role modelling (SSQ7, SSQ18, SSQ29) and item SSQ27 showed the lowest numbers of responses. Response rates for items SSQ7, SSQ18, SSQ29 and SSQ27 were 91.1%, 87.4%, 85.9% and 85.2%, respectively.
Table 2Items and descriptive statistics of the SwissSETQ.
| SwissSETQ item | Res-ponse rate (%) | M ± SD | Md | min/ max | skew | Do-mains in the SETQsmart and simi-larly in the SwissSETQ | SwissSETQ factor* | |
| SSQ01 | I encourage residents to bring up unclear points/problems | 99.3% | 6.60±0.68 | 7 | 4/7 | −1.82 | LK 2 | 1 |
| SSQ02 | I adjust the learning goals to residents’ (learning) needs | 97.8% | 6.08±0.86 | 6 | 3 | −0.88 | LF 2 | 2 |
| SSQ03 | I regularly evaluate residents’ practical skills | 97.8% | 5.60±1.10 | 6 | 2 | −0.68 | Eval 3 | 2 |
| SSQ04 | I explain and substantiate my feedback to residents | 97.8% | 5.98±0.98 | 6 | 2 | −1.29 | FB 3 | 1 |
| SSQ05 | I actively listen to residents | 100% | 6.44±0.69 | 7 | 4 | −1.10 | PH 1 | 1 |
| SSQ06 | I raise the awareness of residents for economic aspects of patient care (e.g. “choosing wisely”) | 98.5% | 5.95±1.02 | 6 | 3 | −0.88 | Prof 6 | 3 |
| SSQ07 | I am a role model for residents as a supervisor/teacher | 91.1% | 5.76±1.02 | 6 | 4 | −0.36 | Vorb 1 | 1 |
| SSQ08 | I encourage residents to actively participate in discussions | 100% | 6.28±0.83 | 6 | 3 | −1.19 | LK 1 | 1 |
| SSQ09 | I give too much responsibility to residents (in relation to their abilities) | 100% | 3.42±1.59 | 3 | 1 | 0.48 | LF 3 | 4 |
| SSQ10 | I regularly evaluate residents’ communication skills with patients/family members | 96.3% | 4.19±1.51 | 4 | 1 | −0.16 | Eval 4 | 2 |
| SSQ11 | I direct residents’ awareness towards ethical aspects of patient care | 99.3% | 5.69±1.06 | 6 | 1 | −1.35 | Prof 4 | 3 |
| SSQ12 | I prepare well for teaching presentations and talks | 94.8% | 6.24±0.99 | 7 | 3 | −1.30 | LK 5 | – |
| SSQ13 | I demand residents for their personal initiative (to a realistic extent) | 91.9% | 5.94±0.85 | 6 | 3 | −0.69 | PH 3 | 1 |
| SSQ14 | I give too little responsibility to residents (in relation to their abilities) | 94.8% | 3.13±1.39 | 3 | 1 | 0.58 | LF 4 | 4 |
| SSQ15 | I regularly evaluate residents’ content knowledge | 94.8% | 5.31±1.03 | 6 | 2 | −0.69 | Eval 1 | 2 |
| SSQ16 | I provide residents with constructive feedback | 95.6% | 5.95±0.78 | 6 | 3 | −1.07 | FB 2 | 1 |
| SSQ17 | I raise the awareness of residents towards future challenges of the healthcare system | 94.1% | 5.65±1.09 | 6 | 2 | −0.77 | Prof 7 | 3 |
| SSQ18 | I am a role model for residents as a physician | 87.4% | 5.75±1.05 | 6 | 2 | −0.75 | Vorb 2 | 1 |
| SSQ19 | I motivate residents for further learning | 95.6% | 6.17±0.84 | 6 | 3 | −1.03 | LK 3 | 1 |
| SSQ20 | I take care for a sufficient supervision of residents | 5.78±0.99 | 6 | 1 | −1.18 | LF 5 | 1 | |
| SSQ21 | I determine the next steps for learning together with residents | 91.9% | 5.08±1.16 | 5 | 1 | −0.47 | FB 4 | 2 |
| SSQ22 | I teach residents the principles of interprofessional/interdisciplinary collaboration | 94.1% | 5.59±1.11 | 6 | 2 | −0.96 | Prof 3 | 1 |
| SSQ23 | I teach residents how to deal with self-committed mistakes | 94.1% | 5.70±0.95 | 6 | 2 | −1.00 | Prof 1 | 1 |
| SSQ24 | I motivate residents to keep up with the current literature | 94.8% | 6.06±0.83 | 6 | 4 | −0.61 | LK 4 | 3 |
| SSQ25 | I behave respectful towards residents | 94.1% | 6.55±0.64 | 7 | 4 | −1.46 | PH 2 | 1 |
| SSQ26 | I make the learning goals for the learning activities clear to the residents | 91.9% | 5.51±0.96 | 6 | 3 | −0.49 | LF 1 | 2 |
| SSQ27 | I regularly perform high quality workplace based assessments with residents (e.g. Mini-CEX, DOPS, etc.) | 85.2% | 4.42±1.80 | 5 | 1 | −0.52 | Eval 6 | 2 |
| SSQ28 | I regularly provide residents with feedback | 93.3% | 5.75±0.94 | 6 | 3 | −0.80 | FB 1 | 2 |
| SSQ29 | I am a role model for residents as a person | 85.9% | 5.59±0.94 | 6 | 4 | −0.22 | Vorb 3 | 1 |
| SSQ30 | I teach an appropriate balance between self-care and the needs of patient care (e.g. adequate working breaks, or to provide emergency care just before knocking-off time) | 93.3% | 5.05±1.32 | 5 | 1 | −0.94 | LF 6 | 1 |
| SSQ31 | I teach residents how to improve the culture of dealing with errors (e.g. “Speak Up” techniques) | 93.3% | 5.49±1.14 | 6 | 2 | −0.65 | Prof 2 | 1 |
| SSQ32 | I teach residents organizational aspects of patient care | 94.1% | 5.63±1.00 | 6 | 2 | −0.93 | Prof 5 | 3 |
| SSQ33 | I regularly evaluate residents’ communication skills within the team (interprofessional/interdisciplinary) | 90.4% | 4.80±1.43 | 5 | 1 | −0.70 | Eval 5 | 2 |
| SSQ34 | I regularly evaluate residents’ analytical competencies | 91.9% | 5.04±1.31 | 5 | 1 | −1.00 | Eval 2 | 2 |
DOPS: Direct Observation of Procedural Skills; M: mean; max: maximum; Md: median; min: minimum; Mini-CEX: Mini Clinical Evaluation Exercise; SD: standard deviation.
* Factors in the Swiss SETQ [3] are as follows: 1 = Individual instruction; 2 = Evaluation of trainee’s performance; 3 = Teaching professionalism; 4 = Entrustment decision.
The Kaiser-Meyer-Olkin coefficient for the original 34-item questionnaire was 0.83 and Bartlett’s test of sphericity was significant (Χ2(561) = 2584.93, p <0.001), thus both indices suggested that data are suitable for factor analysis. As for the original trainee version of the SwissSETQ, the Scree plot suggested extraction of three factors, the latter was confirmed by parallel analysis (appendix figures S1A and S1B). Parallel analysis indicated that three factors are sufficient; subsequently no more or less factors were extracted. According to our statistical quality criteria, eleven items are suggested to be deleted based on statistical analysis alone (loadings smaller than 0.4, high double loadings, table 3 and 4). All further analysis was continued with the suggested shortened version of the questionnaire still comprising three factors but only 23 items. The communality of item SSQ12 (λ = 0.2) fell below the threshold but the item was retained because all other psychometric criteria were good. The first factor named Teaching structure consists of twelve items (α = 0.89), the second factor Attitude of the supervisor consists of eight items (α = 0.77) and the third factor Role modelling consists of three items (α = 0.87).
Table 3Factor loadings and psychometric properties for the 23-item questionnaire.
| Item | Wording | Factor 1 (i = 12) | Factor 2 (i = 8) | Factor 3 (i = 3) | λ | rit | αif deleted |
| SSQ33 | I regularly evaluate residents’ communication skills within the team (interprofessional/interdisciplinary) | 1.01 | 1 | 0.75 | 0.87 | ||
| SSQ34 | I regularly evaluate residents’ analytical competencies | 0.86 | 0.75 | 0.74 | 0.88 | ||
| SSQ26 | I make the learning goals for the learning activities clear to the residents | 0.8 | 0.66 | 0.68 | 0.88 | ||
| SSQ21 | I determine the next steps for learning together with residents | 0.79 | 0.63 | 0.7 | 0.88 | ||
| SSQ27 | I regularly perform high-quality workplace-based assessments with residents (e.g. Mini-CEX, DOPS, etc.) | 0.72 | 0.61 | 0.56 | 0.89 | ||
| SSQ10 | I regularly evaluate residents’ communication skills with patients/family members | 0.68 | 0.49 | 0.55 | 0.89 | ||
| SSQ15 | I regularly evaluate residents’ content knowledge | 0.58 | 0.35 | 0.62 | 0.88 | ||
| SSQ28 | I regularly provide residents with feedback | 0.55 | 0.32 | 0.6 | 0.88 | ||
| SSQ30 | I teach an appropriate balance between self-care and the needs of patient care (e.g. adequate working breaks, or to provide emergency care just before knocking-off time) | 0.54 | 0.3 | 0.49 | 0.89 | ||
| SSQ31 | I teach residents how to improve the culture of dealing with errors (e.g. “Speak Up” techniques) | 0.51 | 0.3 | 0.55 | 0.89 | ||
| SSQ32 | I teach residents organisational aspects of patient care | 0.51 | 0.28 | 0.57 | 0.89 | ||
| SSQ03 | I regularly evaluate residents’ practical skills | 0.45 | 0.25 | 0.59 | 0.88 | ||
| SSQ01 | I encourage residents to bring up unclear points/problems | 0.87 | 0.82 | 0.6 | 0.73 | ||
| SSQ05 | I actively listen to residents | 0.83 | 0.75 | 0.61 | 0.73 | ||
| SSQ08 | I encourage residents to actively participate in discussions | 0.79 | 0.64 | 0.53 | 0.73 | ||
| SSQ06 | I raise the awareness of residents for economic aspects of patient care (e.g. “Choosing wisely”) | 0.69 | 0.54 | 0.45 | 0.75 | ||
| SSQ02 | I adjust the learning goals to residents’ (learning) needs | 0.62 | 0.38 | 0.55 | 0.73 | ||
| SSQ25 | I behave respectful towards residents | 0.54 | 0.33 | 0.3 | 0.78 | ||
| SSQ12 | I prepare well for teaching presentations and talks | 0.44 | 0.2 | 0.33 | 0.77 | ||
| SSQ24 | I motivate residents to keep up with the current literature | 0.43 | 0.25 | 0.56 | 0.74 | ||
| SSQ18 | I am a role model for residents as a physician | 1.06 | 1 | 0.77 | 0.8 | ||
| SSQ29 | I am a role model for residents as a person | 0.76 | 0.64 | 0.83 | 0.73 | ||
| SSQ07 | I am a role model for residents as a supervisor/teacher | 0.62 | 0.45 | 0.84 | 0.72 | ||
| Mean (where applicable) | 0.67 | 0.65 | 0.81 | 0.52 | 0.6 | 0.82 | |
| σ2 proportional | 0.21 | 0.15 | 0.07 | ||||
| σ2 cumulative | 0.21 | 0.35 | 0.43 | ||||
| α | 0.89 | 0.77 | 0.87 | ||||
DOPS: Direct Observation of Procedural Skills; Mini-CEX: Mini Clinical Evaluation Exercise.
Factor loadings represent the strength and direction of an item’s relationship with a factor, with higher absolute values indicating a stronger association. Factor 1 is Teaching structure, factor 2 is Attitude of the supervisor and factor 3 is Role modelling. i is the number of items loading on each factor. λ is the communality, the proportion of an item’s variance explained by the extracted factors, calculated as the squared factor loading. is the total part-whole correlation, the correlation between an item and the total scale score (excluding the item), indicating how well it aligns with the overall construct. αif deleted denotes Cronbach’s α value if the item were deleted from the factor (see the “Statistics” section for how to interpret Cronbach’s α). σ2 is the variance explained by the factor.
Table 4Deleted items.
| Item | Wording | Factor 1 (i = 12) | Factor 2 (i = 8) | Factor 3 (i = 3) | λ |
| Teaching structure | Attitude of the supervisor | Attitude of the supervisor | |||
| SSQ04 | I explain and substantiate my feedback to residents | 0.47 | 0.32 | −0.14 | 0.34 |
| SSQ09 | I give too much responsibility to residents (in relation to their abilities) | 0.33 | −0.07 | −0.16 | 0.14 |
| SSQ11 | I direct residents’ awareness towards ethical aspects of patient care | 0.25 | 0.29 | 0.01 | 0.15 |
| SSQ13 | I demand residents for their personal initiative (to a realistic extent) | 0.12 | 0.38 | 0.15 | 0.18 |
| SSQ14 | I give too little responsibility to residents (in relation to their abilities) | 0.08 | −0.33 | 0.1 | 0.13 |
| SSQ16 | I provide residents with constructive feedback | 0.34 | 0.27 | 0.07 | 0.19 |
| SSQ17 | I raise the awareness of residents towards future challenges of the healthcare system | 0.44 | 0.25 | −0.16 | 0.28 |
| SSQ19 | I motivate residents for further learning | 0.17 | 0.39 | 0.3 | 0.27 |
| SSQ20 | I take care for a sufficient supervision of residents | 0.32 | 0.14 | 0.09 | 0.13 |
| SSQ22 | I teach residents the principles of interprofessional/interdisciplinary collaboration | 0.35 | 0.26 | 0.12 | 0.2 |
| SSQ23 | I teach residents how to deal with self-committed mistakes | 0.37 | 0.31 | −0.04 | 0.23 |
Factor loadings represent the strength and direction of an item’s relationship with a factor, with higher absolute values indicating a stronger association. i is the number of items loading on each factor. λ is the communality, the proportion of an item’s variance explained by the extracted factors, calculated as the squared factor loading.
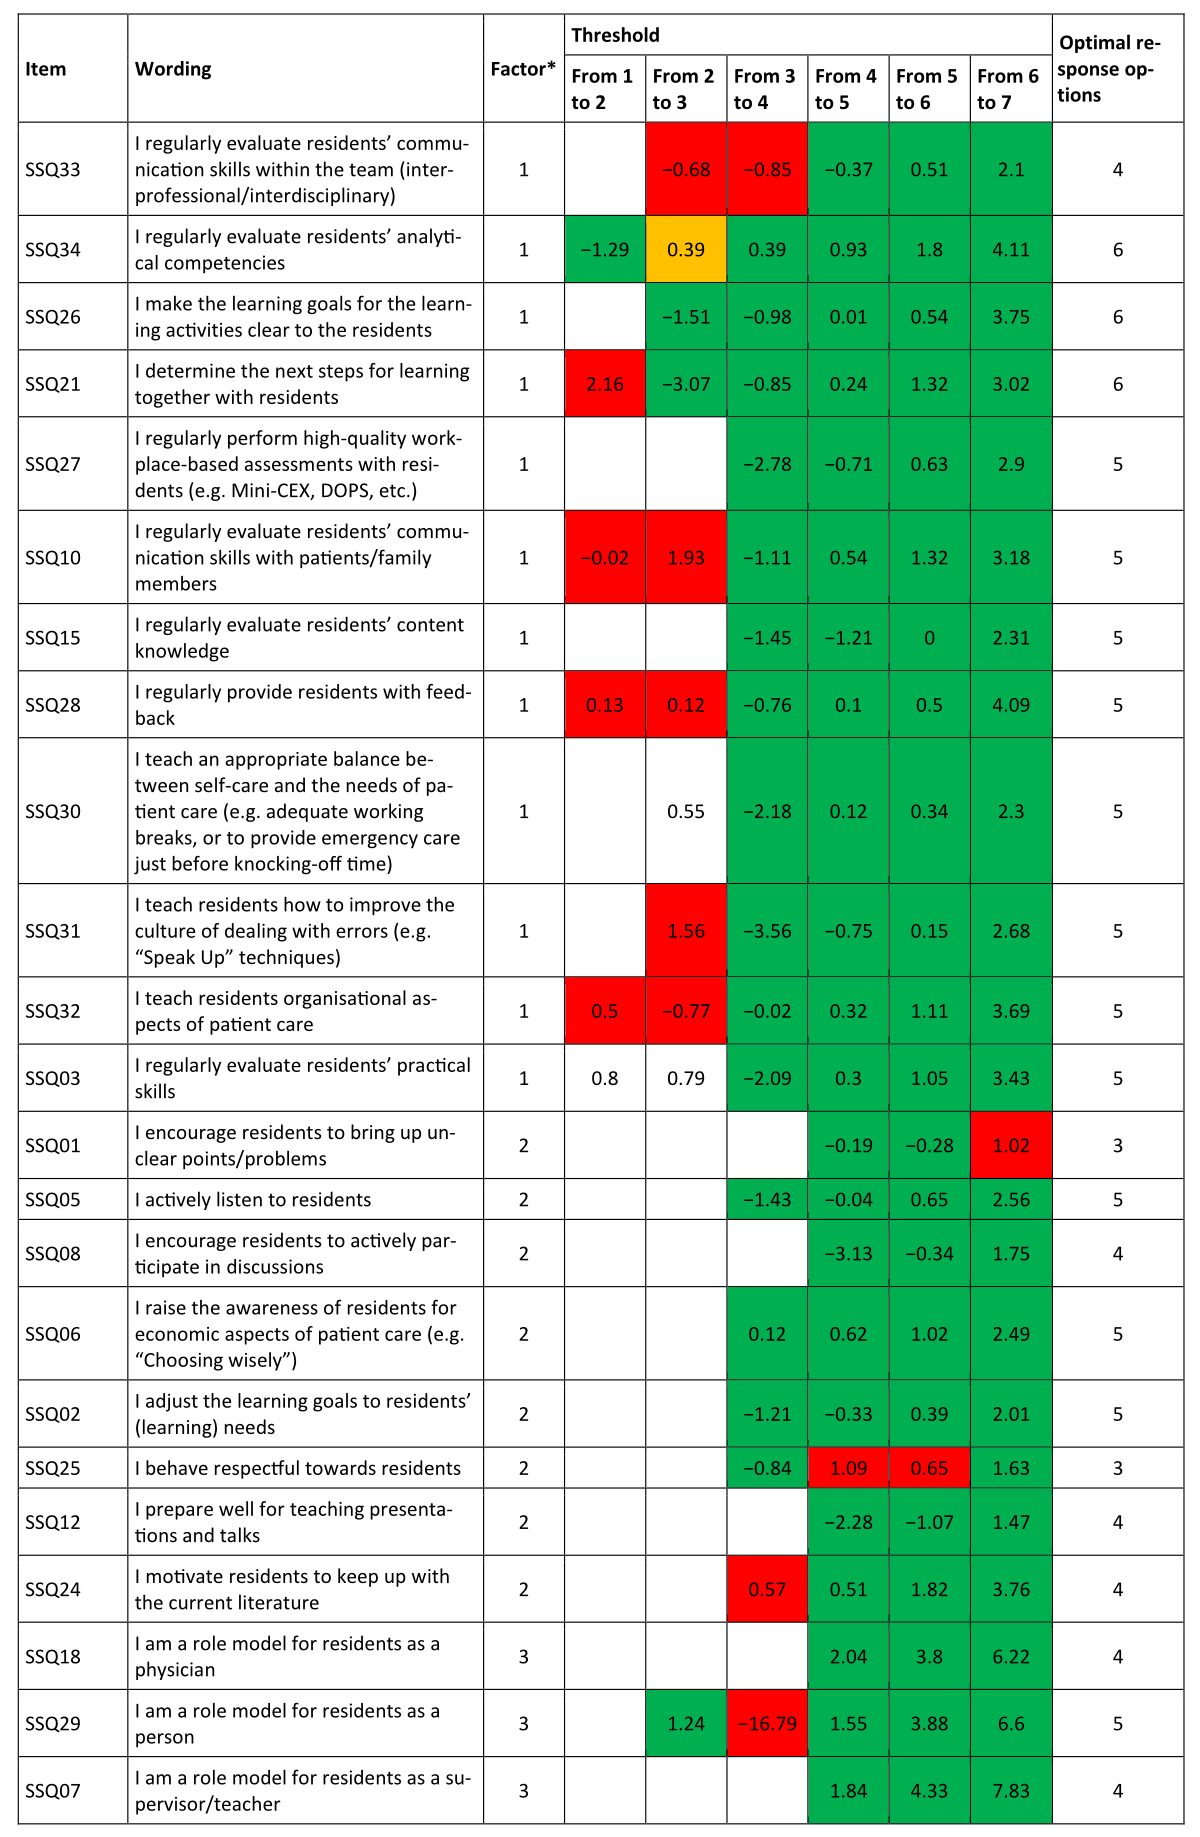
Figure 2Partial credit model. Threshold 1/2 denotes the “difficulty” in endorsing Disagree over Fully disagree, threshold 2/3 Partly disagree over Disagree, threshold 3/4 Neutral over Partly disagree, threshold 4/5 Partly agree over Neutral, threshold 5/6 Agree over Partly agree and threshold 6/7 Strongly agree over Agree. The “Optimal response options” column contains the response category that provides the most reliable information about the item. * Factor 1 is Teaching structure, factor 2 is Attitude of the supervisor and factor 3 is Role modelling. DOPS: Direct Observation of Procedural Skills; Mini-CEX: Mini Clinical Evaluation Exercise.
The part-whole corrected correlation was ≥0.3 for all items; Cronbach’s α indicated that all items substantially contributed to their scales. The response range using the partial credit model could not be analysed for every item. Due to severe threshold disorder, threshold analysis could only be conducted for the shortened version (figure 2). Item thresholds indicated that the 7-point response scale was disordered for eleven items. This is the case if the difficulty in endorsing an item does rise from left to right, e.g. for item SSQ25 (“I behave respectful towards residents”), we see that the “difficulty” as represented by the threshold from 3 to 4 (1.09) is more difficult to endorse than the threshold from response option 5 to 6. In other words, responding with Neutral rather than Partly disagree was more unlikely for respondents than switching from Partly agree to Agree. Linearity for the response scale is violated. When simply computing the scale score as sums of score, the mathematical representation distorts the empirical relation. Subsequently, thresholds were collapsed. According to threshold analysis, a 5-point Likert scale seems most appropriate for factor 1 and a 4-point Likert scale for factor 2 and factor 3. All three scales are significantly positively correlated – see figure 3 – with the highest correlation observed between Attitude of the supervisor and Role modelling.
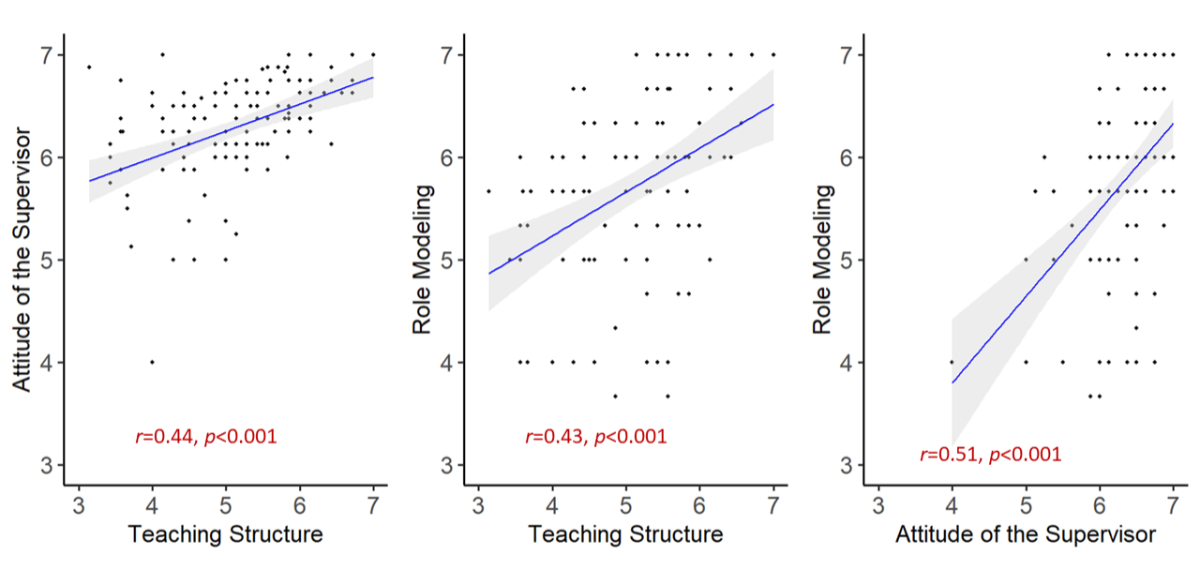
Figure 3Correlation between scales.
No significant differences were determined between the three factors and sociodemographic parameters such as the category of the training centre, the supervisor’s position or whether a respondent has attended a medical education class. In tendency, Attitude of supervisors received highest ratings, followed by Role modelling and Teaching structure (as shown in table 5).
Table 5Sociodemographic parameters in relation to the factors. Categories with fewer than four cases were excluded; these were some categories for medical education training such as Master in Medical Education.
| Sociodemographic parameter, as mean (±standard deviation) | Teaching structure | Attitude of the supervisor | Role modelling | |
| Category | A | 4.7 (±0.8) | 6.2 (±0.6) | 5.6 (±0.9) |
| B | 5.0 (±0.7) | 6.4 (±0.4) | 6.0 (±0.7) | |
| C | 4.8 (±0.9) | 6.4 (±0.5) | 5.5 (±1.0) | |
| D | 5.1 (±1.0) | 6.3 (±0.5) | 5.7 (±0.9) | |
| Language region | German | 4.8 (±0.8) | 6.2 (±0.3) | 6 (±1.0) |
| French | 5.2 (±0.9) | 6.4 (±0.6) | 6.1 (±0.6) | |
| Italian | 4.9 (±0.6) | 6.2 (±0.5) | 5.9 (±0.4) | |
| Position of the supervisor | Senior physician | 4.8 (±0.9) | 6.2 (±0.8) | 5.5 (±0.9) |
| Head physician | 4.6 (±0.8) | 6.2 (±0.6) | 5.6 (±1.0) | |
| Chief physician | 5 (±0.6) | 6.5 (±0.3) | 6.1 (±0.7) | |
| Doctor in practice | 5.19 (±0.9) | 6.3 (±0.5) | 5.7 (±1.0) | |
| Other | 4.94 (±0.4) | 6.3 (±0.3) | 6.1 (±0.4) | |
| Medical education | Didactic course | 5.2 (±0.7) | 6.2 (±0.4) | 4.0 (±0.7) |
| No | 5.3 (±0.7) | 6.2 (±0.4) | 4.2 (±0.6) | |
| “Teach the Teacher” class | 5.2 (±0.9) | 6.4 (±0.3) | 4.0 (±0.6) | |
Several statements in the free-text comments in the questionnaire covered the time for teaching and the fact that the assessments are often forgotten in everyday clinical practice. Examples of these are “More regular use and dedicated time slots necessary”, “There needs to be adequate time dedicated for medical education during clinical work”, “Fixed schedule for EPAs. E.g every friday 13:00. + 5 minutes feedback and extra teaching for trainee”, “Frequent reminders for the Trainees to ask for EPAs.” or “Often the problem is the lack of time for the EPAs especially in high-volume settings (angiography etc)”.
Another two comments emphasised that assessments entail additional work and cannot change teaching culture without an underlying change of the mindset: “It is additional paperwork that does neither reflect the actual teaching and education quality of the training centre nor the actual skills of the trainee” and “Additional administrative paperwork as for MiniCEX/DOPS etc. will never be able to change the teaching culture in a hospital. Teaching is a way and general mindset of working and not based on checkboxes or apps”.
This study aimed to psychometrically validate the English-language, supervisor-adapted version of the SwissSETQ questionnaire, expanding its applicability across Switzerland’s multilingual context and addressing the need for a robust supervisor-specific self-assessment tool. The findings indicate that the factor structure of the original trainee version can largely be replicated. The replication of the 3-factor structure aligns with earlier findings by Lombarts et al. (2016) [4] on the SETQsmart, reinforcing the instrument’s conceptual foundation in assessing clinical supervision quality. These results contribute to the development of a standardised, competency-based evaluation instrument for clinical supervisors in medical education. In the following sections, we structure the discussion around key aspects of our findings and their significance related to the existing literature. Additionally, we address the limitations of the study and their implications for future research and practical applications.
Since the total number of cardiologists who were contacted by our inquiry is unknown, our response rate is only an estimate. Based on an estimated total of 600 cardiologists, we calculate a response rate of 23%. Data quality is considered high, as quantitative and qualitative responses corresponded perfectly [30].
The analysis of sociodemographic parameters in relation to the factors showed no significant differences when comparing sex, teaching centre category, role, employment level or medical education training. We did not observe any significant differences among the three language regions (German-, French-, Italian-speaking). This suggests that the English version of the questionnaire is suitable for use across all three language regions, enhancing its applicability and utility.
Although we could not replicate the 4-factor structure described by Breckwoldt et al. (2022), the domains align closely with the domains used by Breckwoldt et al. in the SwissSETQ and before by Lombarts at al. in the SETQsmart [3, 4]. The identification of three factors – Teaching structure, Attitude of the supervisor and Role modelling – and the reduction to 23 items demonstrate a clear structure and good psychometric properties of the questionnaire. The domains sort to these three factors as shown in figure 4.
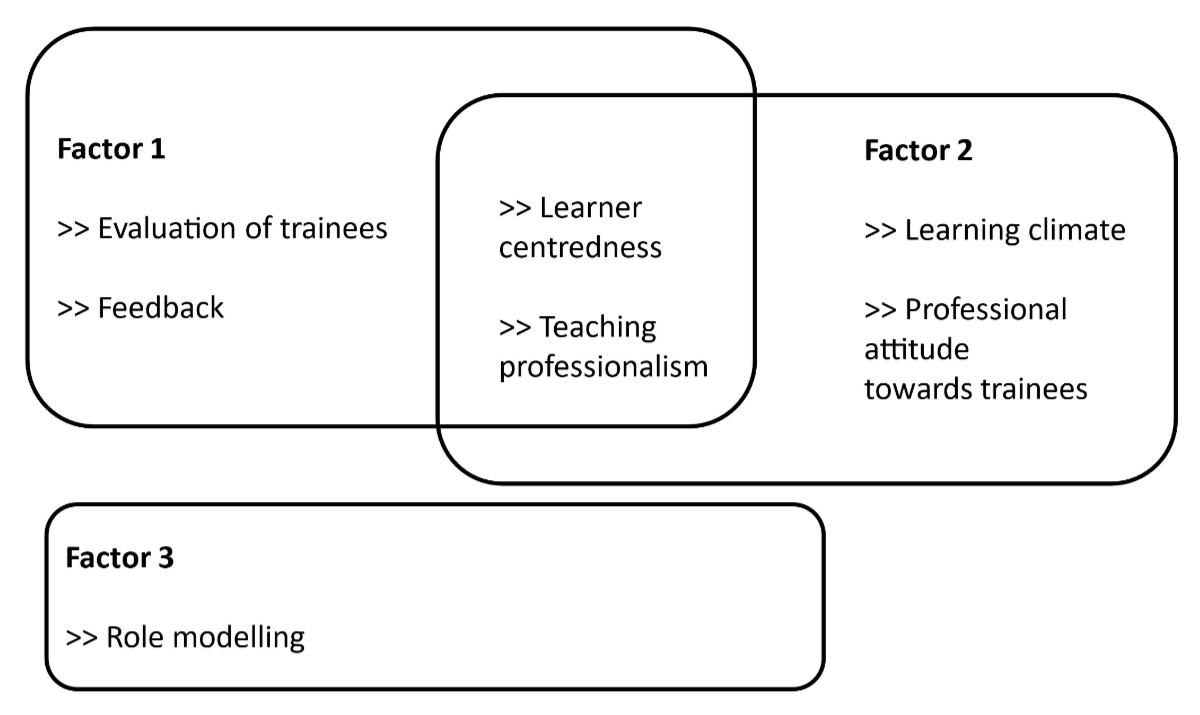
Figure 4Domains and factors: Sorting the SwissSETQ domains to our 3-factor structure.
The high internal consistency of these factors, as indicated by Cronbach’s α, shows that the domains can still be measured with fewer items at least on an aggregated level. The latter represents a starting point for short-form measures whenever the latent constructs rather than discrete items are the focus of interest.
Our proposed 3-factor structure would necessitate the removal of 11 items, which must be assessed for content relevance. For two of these items, we suspect that their weak factor loading may be due to ambiguous or cumbersome formulation of the two questions: “I give too much responsibility to residents (in relation to their abilities)” and “I give too little responsibility to residents (in relation to their abilities)”. The other nine items showed weak loading or double loading. Three of the eleven items (“[…] teaches the principles of interprofessional / interdisciplinary collaboration to me”, “[…] directs my awareness towards ethical aspects of patient care”, “[…] raises my awareness towards future challenges of the health care system”) were introduced by Breckwoldt et al. to address aspects of the CanMEDS 15 update and the construct of EPAs in training. Removing the 11 items and thereby shortening the questionnaire might be considered from a statistical perspective, but only done if necessary, such as for improved acceptance or feasibility. Lengthy questionnaires can have drawbacks, such as a refusal to cooperate and lower motivation, as well as decrease in response quality compared to short forms [34, 35]. Given that the questionnaire was intended for formative use, each item offers valuable, specific feedback. Therefore, we do not recommend deleting these items without a clear and specific reason.
A notable finding of the study is the relatively low response rate to questions addressing Role modelling (“I am a role model for residents as a supervisor/teacher”, “I am a role model for residents as a physician”, “I am a role model for residents as a person”) compared to the average response rate. This observation is supported by the free-text comments, where it was mentioned that these questions were perceived as redundant. Participants expressed that they considered the questions on this topic excessive, which contributed to the lower response rate observed.
The fourth item with a lower response rate was item 27: “I regularly perform high-quality workplace-based assessments with residents (e.g. Mini Clinical Evaluation Exercise [Mini-CEX], Direct Observation of Procedural Skills [DOPS], etc.)”. In addition, this item was answered very heterogeneously. We cannot fully explain this finding. We suspect that a perceived discrepancy between national regulations, which mandate regular workplace-based assessments, and the reality, where these assessments are not performed regularly, may play a role. Additionally, the mention of MiniCEX and DOPS in a study on EPAs might have confused the participants.
We observed that the scale was left-skewed and not used in its full range, with mean values between 3.13 and 6.60 indicating total disagreement to total agreement (1 = “I fully disagree”, 7 = “I fully agree”); see table 2. Consequently, a partial credit model was performed. The evaluation of response options using the partial credit model suggests that the questionnaire would be more effective with a 4- or 5-point Likert scale rather than a 7-point scale; see figure 2. We hypothesise that a 4-point Likert scale would reduce disorder in responses, although the left-skewed distribution is likely to remain.
Despite its valuable findings, the study has certain limitations. The sample size, though sufficient for the analyses conducted, may still be a limitation and might not be representative of all regions in Switzerland, especially the Italian-speaking part. Cultural and institutional differences within Switzerland could affect the generalisability of the results, suggesting that findings might vary in different settings. Additionally, the possibility of a self-selection bias could have influenced the results, as supervisors who are more motivated or dissatisfied might have been more likely to participate in the survey. Furthermore, our validation focused on psychometric properties like factor structure and internal consistency but did not compare self-assessments with trainee evaluations. Future studies should explore this to strengthen the tool’s convergent validity.
The frequent mention of time constraints for teaching and assessments in clinical practice, as noted in the free-text comments, points to structural issues that need to be addressed in order to improve teaching quality. Comments such as the need for fixed time slots and regular reminders for teaching activities suggest that supervisors are struggling to find adequate time for educational duties amid their clinical responsibilities.
The implications for practice are significant. The study aimed to evaluate the linguistic and conceptual equivalence between the original SwissSETQ and its English version for supervisors. The findings indicate successful equivalence across both linguistic and conceptual domains. Additionally, robust psychometric properties, including high reliability and validity of the translated questionnaire, were demonstrated. These results affirm that the English version effectively captures essential aspects of the supervision of residency training. The adapted SwissSETQ allows supervisors to improve on their teaching and supervisory behaviours, and to track their professional growth over time through repeated use. It can serve as a practical tool for faculty development.
Future research should focus on further developing and refining the SwissSETQ tool to enhance its applicability and usability in diverse settings. Future studies could explore the longitudinal use of the instrument to track changes in supervisors’ self-assessment over time and its potential impact on teaching practices. Additionally, validating the tool across various medical specialties beyond cardiology would provide a broader understanding of its generalisability and relevance. Another critical avenue for research is investigating the relationship between self-assessment using the SwissSETQ and feedback from trainees to evaluate whether the tool accurately reflects supervisory quality and aligns with trainee perceptions.
As analysis has demonstrated that psychometric properties and factor structure need to be evaluated employing a 5-point Likert scale. Depending on the research question and research setting, the instrument’s psychometric properties may lend themselves to the development of short-form scales. Furthermore future research should aim to investigate additional variables, such as the impact of the work environment, motivation of individual supervisors and the specific needs of trainees. This approach could provide a more comprehensive understanding of the factors that influence teaching quality in medical education.
Data were collected anonymously, with informed consent from all participants. Data were processed and stored according to Swiss data protection laws. The dataset supporting the findings is available upon reasonable request.
Author contributions: Design, data and interpretation: FS, JB, EKH. Drafting for intellectual content: FS, JB, EKH. Revision for intellectual content: FS, JB, EKH, MBM. Final approval and responsibility for the article: FS, JB, EKH, MBM.
Funding agreement between Novartis Pharma Schweiz AG and Insel Gruppe AG for investigating implementation of Entrustable Professional Activities in cardiology postgraduate training in Switzerland. FS received funding from Novartis Pharma Schweiz AG for this study. The funding did not influence the research question or analysis of data in any way.
All authors have completed and submitted the International Committee of Medical Journal Editors form for disclosure of potential conflicts of interest. FS received funding from Novartis Pharma Schweiz AG for this study. The funding did not influence the research question or analysis of data in any way. No other potential conflict of interest related to the content of this manuscript was disclosed.
1. Artino AR Jr, La Rochelle JS, Dezee KJ, Gehlbach H. Developing questionnaires for educational research: AMEE Guide No. 87. Med Teach. 2014 Jun;36(6):463–74.
2. Thomet C, Moons P, Schwerzmann M, Schwitz F. Development of quality indicators of transfer and transition in adolescents and young adults with congenital heart disease. BMC Health Serv Res. 2023 Oct;23(1):1154.
3. Breckwoldt J, Marty AP, Stricker D, Stolz R, Thomasin R, Seeholzer N, et al. Bottom-up feedback to improve clinical teaching: validation of the Swiss System for Evaluation of Teaching Qualities (SwissSETQ). Swiss Med Wkly. 2022 Mar;152(1112):w30137.
4. Lombarts KM, Ferguson A, Hollmann MW, Malling B, Arah OA; SMART Collaborators. Redesign of the System for Evaluation of Teaching Qualities in Anesthesiology Residency Training (SETQ Smart). Anesthesiology. 2016 Nov;125(5):1056–65.
5. SoSci Survey (Version 3.5.02) 2024. Internet: https://www.soscisurvey.de
6. de Winter JC, Dodou D, Wieringa PA. Exploratory Factor Analysis With Small Sample Sizes. Multivariate Behav Res. 2009;44(2):147–81.
7. Rules FE. Standard practice in social science. In: Osborne J, editor. Best Practices in Quantitative Methods. SAGE Publications, Inc; 2008.
8. McNeish D. Exploratory Factor Analysis With Small Samples and Missing Data. J Pers Assess. 2017;99(6):637–52.
9. Goretzko D, Pham TT, Bühner M. Exploratory factor analysis: current use, methodological developments and recommendations for good practice. Curr Psychol. 2021;40(7):3510–21.
10. Masters GN. Partial credit model. Handbook of Item Response Theory. 1st ed. Chapman and Hall/CRC; 2016. pp. 137–54.
11. Hambleton RK, Jones RW. An NCME Instructional Module on Comparison of classical test theory and item response theory and their applications to test development. Educ Meas. 1993;12(3):38–47.
12. R Core Team. R: A language and environment for statistical computing. R Foundation for Statistical Computing, Vienna, Austria. 2021. Internet: https://www.R-project.org/
13. Wickham H, Francois R, Henry L, Müller K, Vaughan D. dplyr: A Grammar of Data Manipulation. Internet: https://dplyr.tidyverse.org/
14. Revelle W. psych: Procedures for Psychological, Psychometric, and Personality Research. 2024. Available from: https://cran.rediris.es/web/packages/psych/psych.pdf
15. Zeileis A, Grothendieck G. zoo: S3 Infrastructure for Regular and Irregular Time Series. J Stat Softw. 2005;14(6):1–27.
16. Wickham H. ggplot2: Elegant Graphics for Data Analysis. Cham: Springer International Publishing; 2016. https://doi.org/
17. Yanagida T. misty: Miscellaneous Functions ’T. Yanagida’. Internet: https://rdrr.io/cran/misty/
18. Mair P, Hatzinger R. Extended Rasch Modeling: The eRm Package for the Application of IRT Models in R. J Stat Softw. 2007;20(9):1–20.
19. Juhola M, Laurikkala J. Missing values: how many can they be to preserve classification reliability? Artif Intell Rev. 2013;40(3):231–45.
20. Gravetter FJ, Wallnau LB. Statistics for The Behavioral Sciences. Cengage; 2016.
21. Beavers AS, Lounsbury JW, Richards JK, Huck SW, Skolits GJ, Esquivel SL. Practical Considerations for Using Exploratory Factor Analysis in Educational Research. Pract Assess Res Eval. 2013;18:1–13.
22. Williams B, Onsman A, Brown T. Exploratory Factor Analysis: A Five-Step Guide for Novices. Australas J Paramed. 2010;8:1–13.
23. Stevens JP, Stevens JP. Applied Multivariate Statistics for the Social Sciences. 4th ed. New York: Psychology Press; 2001.
24. Marsh HW, Hau KT, Balla JR, Grayson D. Is More Ever Too Much? The Number of Indicators per Factor in Confirmatory Factor Analysis. Multivariate Behav Res. 1998 Apr;33(2):181–220.
25. Nunnally JC. An Overview of Psychological Measurement. In: Wolman BB, editor. Clin. Diagn. Ment. Disord. Handb. Boston (MA): Springer US; 1978. pp. 97–146.
26. Masters GN. A Rasch model for partial credit scoring. Psychometrika. 1982;47(2):149–74.
27. Luo G. The relationship between the Rating Scale and Partial Credit Models and the implication of disordered thresholds of the Rasch models for polytomous responses. J Appl Meas. 2005;6(4):443–55.
28. Peterson RA. A Meta-Analysis of Variance Accounted for and Factor Loadings in Exploratory Factor Analysis. Mark Lett. 2000;11(3):261–75.
29. Nanda A, Mohapatra DB, Mahapatra AP, Mahapatra AP, Mahapatra AP. Mohapatra DrBB, Mahapatra APK, Mahapatra APK, Mahapatra APK. Multiple comparison test by Tukey’s honestly significant difference (HSD): do the confident level control type I error. Int J Stat Appl Math. 2021;6(1):59–65.
30. Dillman DA, Bowker DK. The Web Questionnaire Challenge to Survey Methodologists. In: Reips UD, Bosnjak M, editors. Dimens. Internet Sci., Lengerich. Pabst Science Publishers; 2001. pp. 159–78.
31. Deutskens E, De Ruyter K, Wetzels M, Oosterveld P. Response Rate and Response Quality of Internet-Based Surveys: An Experimental Study. Mark Lett. 2004;15(1):21–36. doi: https://doi.org/10.1023/B:MARK.0000021968.86465.00
32. Denscombe M. Item non‐response rates: a comparison of online and paper questionnaires. Int J Soc Res Methodol. 2009;12(4):281–91.
33. Harel D, Steele RJ. An Information Matrix Test for the Collapsing of Categories Under the Partial Credit Model. J Educ Behav Stat. 2018;43(6):721–50.
34. Rolstad S, Adler J, Rydén A. Response burden and questionnaire length: is shorter better? A review and meta-analysis. Value Health. 2011 Dec;14(8):1101–8.
35. Galesic M, Bosnjak M. Effects of Questionnaire Length on Participation and Indicators of Response Quality in a Web Survey. Public Opin Q. 2009;73(2):349–60.
The appendix is available in the pdf version of the article at https://doi.org/10.57187/s.4178.