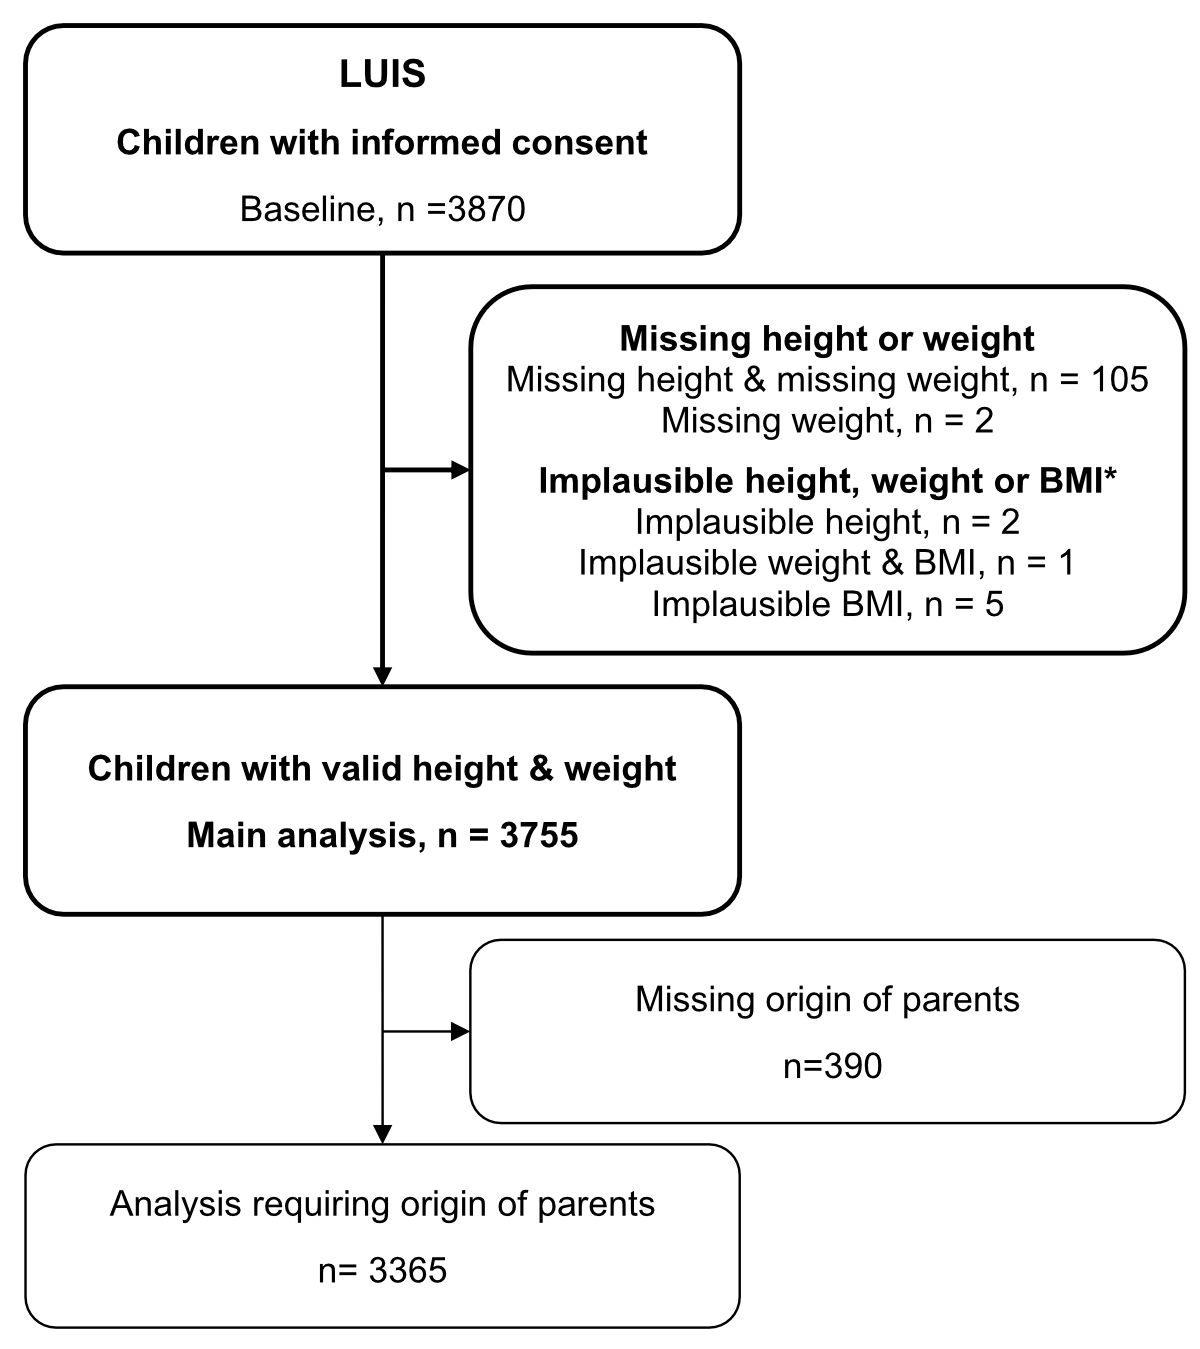
Figure 1Flow diagram of the study population. * We excluded 8 children with recentered height, weight, or BMI z-scores <−4 or >4.
DOI: https://doi.org/https://doi.org/10.57187/s.3834
body mass index
International Obesity Task Force
LuftiBus in the School
Paediatric Endocrinology Centre Zurich
Swiss neighbourhood index of socioeconomic position
World Health Organization
Growth references and their corresponding percentile curves are used by general practitioners and specialist paediatricians (a) to detect abnormal growth patterns that could be related to underlying physical diseases or developmental disorders, (b) to identify short stature or overgrowth, and (c) to determine whether a child fulfils criteria for overweight or obesity based on body mass index (BMI) percentiles. Early identification of atypical growth patterns and developmental deviations is crucial for prompt intervention and management of chronic conditions or developmental delays. For example, short stature can indicate endocrinological, genetic or chronic systemic diseases. Correct detection of obesity in children is important because childhood obesity is a known predictor of ill health in adulthood and is associated with cardiovascular disease, type 2 diabetes and cancer [1, 2].
In 2011, the Swiss Society of Paediatrics (SSP) replaced the growth curves from the Zurich Longitudinal Studies [3] by the WHO curves. For this purpose, several WHO datasets were merged and reanalysed [4]. The growth references for schoolchildren and adolescents aged 5 to 19 years were derived from data of white and African American children collected in the US between 1963 and 1974 [5–8]. The new growth curves remained a topic of debate. Humans grow taller now than they did several decades ago, and growth varies across ethnicities and regions of the world [9, 10]. Thus, the WHO growth references reflect a different population from the one that lives in Switzerland today and the representativeness of the references has been questioned [11, 12]. In 2019, the Paediatric Endocrinology Centre Zurich (PEZZ), an endocrinology group practice, proposed alternative growth references for Swiss children. These references were based on data from paediatric primary care practices, school medical services, the federal statistical office and the Swiss military medical service, primarily representing central and eastern regions of Switzerland [13]. A third growth reference that is being used in Switzerland was published by the International Obesity Task Force (IOTF) based on data collected between 1963 and 1993 from children in Brazil, Hong Kong, the Netherlands, Singapore, the UK and the USA [14]. In Switzerland, the IOTF references are mainly used by paediatric endocrinologists or researchers to assess overweight and obesity in children.
Given this diversity of growth references used in parallel in Switzerland, we reused data from a large population-based study of schoolchildren from the canton of Zurich, the “LuftiBus in the School” (LUIS) study, to compare the fit of anthropometric data of these children to WHO, PEZZ and IOTF growth references. We examined the fit for the entire study population and for subgroups defined by sex, age, origin of parents, socioeconomic status and degree of urbanisation. We also investigated how prevalence estimates of overweight, obesity and short stature would vary depending on the growth references used to classify the data.
The “LuftiBus in the School” (LUIS) study was a cross-sectional study of lung health in schoolchildren aged 6–17 years conducted from 2013 to 2016 in the canton of Zurich (ClinicalTrials.gov NCT03659838, described in detail elsewhere [15]). All 490 schools in the canton of Zurich were invited to participate and 37 schools accepted. Participating schools were visited by a bus – the LuftiBus – equipped with spirometers and scales to measure lung function and anthropometric parameters. The study was approved by the ethics committee of the canton of Zurich (KEK-ZH-Nr: 2014-0491) and informed consent, including information on reuse of anonymised data for research purposes, was obtained prior to participation.
At the start of the study, LuftiBus technicians received training on measuring height and weight according to WHO recommendations [16]. For anthropometric measurements, children removed their shoes and wore light clothing. LuftiBus technicians used a calibrated stadiometer to record body height to the closest centimetre and a calibrated scale to record body weight to the nearest 100 grams. We calculated age- and sex-dependent z-scores for height, weight and BMI based on WHO [4], PEZZ [13] and IOTF [14] growth references using Cole’s Lambda-Mu-Sigma (LMS) method [17] (see appendix). We adapted a method by Daymont et al. [18] to detect possible outliers resulting from recording or transcription errors by the LUIS study team: We recentred height, weight and BMI z-scores around the median z-score at each age year to account for the possibility that the whole study sample might differ from the reference population. We then excluded children with a recentred z-score <−4 or >4 as recommended [16, 19].
We used cutoff values for BMI z-scores published by the WHO, PEZZ and IOTF growth references to classify children into normal weight, overweight, obesity and severe obesity (appendix table S1). We defined short stature as <3rd percentile, normal height as between the 3rd and 97th percentiles, and tall stature as >97th percentile for all references [20].
We obtained socioeconomic information (origin of parents, education of parents, home address) from parent-completed questionnaires. We grouped parental countries of origin into five categories: Switzerland (both parents born in Switzerland), Switzerland one parent (one parent born in Switzerland, other parent born outside of Switzerland), Northern/Western Europe (both parents born in northern or western Europe), Southern/Eastern Europe (both parents born in southern or eastern Europe), Other/Mixed (parents born in Africa, America, Asia, or Oceania or parents with mixed origin excluding Swiss parents). We defined these geographical regions based on the United Nations standard country or area codes for statistical use, M49 [21]. We classified education of parents into three categories based on the highest education level achieved by one of the parents: primary education (compulsory schooling only; ≤9 years), secondary education (vocational training; 10–13 years) and tertiary education (higher vocational training, college or university degree; ≥14 years). We used the Swiss neighbourhood index of socioeconomic position (Swiss-SEP) as an area-based measure of socioeconomic status [22]. The Swiss-SEP ranges from 0 to 100 where a higher value reflects a higher socioeconomic position of that neighbourhood. We assigned the nearest Swiss-SEP value to the geographical coordinates of the children’s home address. When the home address was missing (n = 405, 11%), we assigned the median Swiss-SEP value of children attending the same school. We classified Swiss-SEP into five categories based on the quintiles published by Panczak et al. [22]. We classified degree of urbanisation into three categories based on the location of the school and according to the classification of the Federal Statistical Office [23]: large urban (cities ≥50,000 inhabitants and population density ≥1500/km2), small urban (towns and suburbs ≥5000 inhabitants and population density ≥300/km2) and rural (outside of large and small urban regions).
We assessed the fit of children in LUIS to the three growth references by calculating means and standard deviations for height, weight and BMI z-scores. In a perfectly fitting sample, the z-scores would be standard normally distributed (mean 0, SD 1). We classified mean z-scores deviating >0.5 from the reference population as strong deviations, 0.25–0.5 as moderate deviations, 0.05–0.25 as weak deviations and 0–0.05 as no noticeable deviations [10]. We used the Anderson-Darling test to assess the fit of z-score distributions to the expected standard normal distribution, as it allows for comparing two distributions. The test quantifies goodness of fit using the A2 statistic, where lower values indicate a better fit. The p-value represents the probability of the null hypothesis that the z-score distribution is drawn from a standard normal distribution. The Kolmogorov-Smirnov test produced similar results (available upon request).
We assessed the fit to growth references in the entire population and within strata defined by factors selected a priori based on a literature review and expert opinion: sex, age, origin of parents, Swiss-SEP and degree of urbanisation. For this, we estimated mean z-scores by age and their pointwise 95% confidence interval (CI) using penalised cubic (3rd degree) B-spline regression over age for girls and boys separately to assess the fit of the growth references graphically across age [24]. We also employed penalised cubic B-spline regression to compare mean height, weight, and BMI of children in LUIS with the 50th percentiles of WHO, PEZZ and IOTF growth references across age. We compared the fit to growth references across potential explanatory factors again by computing the Anderson-Darling A2. Furthermore, we used univariable linear regression models to determine the association between potential explanatory factors and z-scores of height, weight and BMI. We chose to report regression results exclusively for z-scores based on PEZZ references because these provided the best correction for age and sex, and the results were consistent with those obtained from other references. We included variables jointly in multivariable models based on significance in univariable models (p <0.05) and measures of model fit.
We calculated the prevalence of BMI and height categories and their 95% CI based on the different references. We used Cohen’s Kappa to quantify agreement between growth references. We interpreted Cohen’s Kappa 0.41–0.60 as moderate, 0.61–0.80 as substantial and 0.81–1.00 as almost perfect agreement according to Landis and Koch [25]. We repeated prevalence estimates of BMI and height categories in strata defined by sex, age, origin of parents, Swiss-SEP and degree of urbanisation.
We used the statistical software R Studio version 2023.3.1 [26] with the R version 4.2.0 [27] for all analyses.
Of 3870 eligible children from the LUIS study, we excluded 107 children with missing height or weight measurements, and a further 8 children with height, weight or BMI z-scores of <−4 or >4 (figure 1), leaving 3755 children (50% girls) in our analysis. For analyses requiring the origin of the parents, we further excluded 390 (10%) children with unknown origin of parents.
Figure 1Flow diagram of the study population. * We excluded 8 children with recentered height, weight, or BMI z-scores <−4 or >4.
The median age was 13 years (IQR 10–14, table 1 and appendix table S2). Most children had parents originally from Switzerland (both parents: 51%, one parent: 16%). The median Swiss-SEP was 69 (IQR 61–76), and half of the children were in the highest Swiss-SEP quintile category. Boys and girls had similar median height and weight.
Table 1Characteristics of participants of the LuftiBus in the School (LUIS) study.
| Girls, n (%) | Boys, n (%) | Total, n (%) | |||
| 1872 (50%) | 1883 (50%) | 3755 (100%) | |||
| Age in years | Median (IQR) | 12.8 (10.1–14.2) | 12.7 (9.9–14.3) | 12.8 (10.0–14.3) | |
| Groups, n (%) | 6–8 | 333 (18%) | 345 (18%) | 678 (18%) | |
| 9–11 | 441 (24%) | 440 (23%) | 881 (23%) | ||
| 12–14 | 838 (45%) | 825 (44%) | 1663 (44%) | ||
| 15–17 | 260 (14%) | 273 (14%) | 533 (14%) | ||
| Origin of parents, n (%) | Switzerland (both parents) | 965 (52%) | 968 (51%) | 1933 (51%) | |
| Switzerland (one parent) | 279 (15%) | 305 (16%) | 584 (16%) | ||
| Northern/Western Europe (both parents) | 103 (6%) | 100 (5%) | 203 (5%) | ||
| Southern/Eastern Europe (both parents) | 199 (11%) | 183 (10%) | 382 (10%) | ||
| Other/Mixed | 142 (8%) | 121 (6%) | 263 (7%) | ||
| Missing | 184 (10%) | 206 (11%) | 390 (10%) | ||
| Education of parents, n (%) | Primary education | 54 (3%) | 51 (3%) | 105 (3%) | |
| Secondary education | 475 (25%) | 473 (25%) | 948 (25%) | ||
| Tertiary education | 714 (38%) | 679 (36%) | 1393 (37%) | ||
| Missing | 629 (34%) | 680 (36%) | 1309 (35%) | ||
| Swiss-SEP 2.0* | Median (IQR) | 69 (61–76) | 69 (62–77) | 69 (61–76) | |
| Groups, n (%) | 1: 0–49 | 70 (4%) | 68 (4%) | 138 (4%) | |
| 2: 50–56 | 232 (12%) | 227 (12%) | 459 (12%) | ||
| 3: 57–61 | 221 (12%) | 210 (11%) | 431 (11%) | ||
| 4: 62–69 | 405 (22%) | 436 (23%) | 841 (22%) | ||
| 5: 70–100 | 944 (50%) | 942 (50%) | 1886 (50%) | ||
| Urbanisation, n (%) | Rural | 128 (7%) | 119 (6%) | 247 (7%) | |
| Small urban: towns, suburbs | 807 (43%) | 828 (44%) | 1635 (44%) | ||
| Large urban: cities | 937 (50%) | 936 (50%) | 1873 (50%) | ||
| Height in cm | Median (IQR) | 156 (141–164) | 156 (141–170) | 156 (141–166) | |
| Weight in kg | Median (IQR) | 45 (33–56) | 44 (33–58) | 45 (33–57) | |
IQR: interquartile range.
* Swiss-SEP: Swiss socioeconomic position version 2.0, census data for period 2012–2015. The five groups are based on quintiles published by Panczak et al. [22]. A higher score corresponds to a higher socioeconomic position.
Children in LUIS deviated strongly in height (mean z-score: 0.56), moderately in weight (0.28) but only weakly in BMI (0.06) from WHO references according to the criteria of Natale et al. [10] (table 2). Mean height (0.15) and weight (0.06) deviated weakly, while BMI (−0.01) did not deviate noticeably from PEZZ references. Mean BMI (0.19) deviated weakly from IOTF references.
According to the Anderson-Darling test, body height of children in LUIS fit better to PEZZ references (A2: 48.1) than to WHO references (A2: 578.1) (table 2 and figure 2). The distribution of height measurements in LUIS deviated significantly from both reference populations (test for standard normal distribution of z-scores, p <0.001). Body weight in LUIS fit better to PEZZ (A2: 10.0) than to WHO references (A2: 123.8), but neither of the z-scores followed the standard normal distribution (p <0.001). BMI in LUIS fit better to PEZZ (A2: 0.8) than to WHO (A2: 24.3) and IOTF references (A2: 64.1). Only the PEZZ BMI z-scores agreed with the standard normal distribution (p = 0.474).
Table 2Mean height, weight and BMI z-scores of 3755 participants of the LuftiBus in the School (LUIS) study based on the WHO, PEZZ and IOTF references; and the fit of the z-scores to a standard normal distribution.
| World Health Organization (WHO) | Paediatric Endocrinology Centre Zurich (PEZZ) | International Obesity Task Force (IOTF) | |||
| Height z-score | Mean (95% CI) | 0.56 (0.53–0.59) | 0.15 (0.12–0.19) | NA | |
| Standard deviation | 1.00 | 1.03 | NA | ||
| Anderson-Darling test* | A2 | 578.1 | 48.1 | NA | |
| p-value | <0.001 | <0.001 | NA | ||
| Weight z-score | Mean (95% CI) | 0.28 (0.25–0.31) | 0.06 (0.03–0.09) | NA | |
| Standard deviation | 1.01 | 0.98 | NA | ||
| Anderson-Darling test* | A2 | 123.8 | 10.0 | NA | |
| p-value | <0.001 | <0.001 | NA | ||
| Body mass index z-score | Mean (95% CI) | 0.06 (0.03–0.10) | −0.01 (−0.04–0.02) | 0.19 (0.16–0.23) | |
| Standard deviation | 1.14 | 1.01 | 1.05 | ||
| Anderson-Darling test* | A2 | 24.3 | 0.8 | 64.1 | |
| p-value | <0.001 | 0.474 | <0.001 | ||
CI: confidence interval; NA: not applicable.
* Anderson-Darling test to assess goodness of fit of the observed z-score distribution based on the WHO, PEZZ and IOTF growth references to a standard normal distribution, A2: test statistic (lower value indicates better fit).
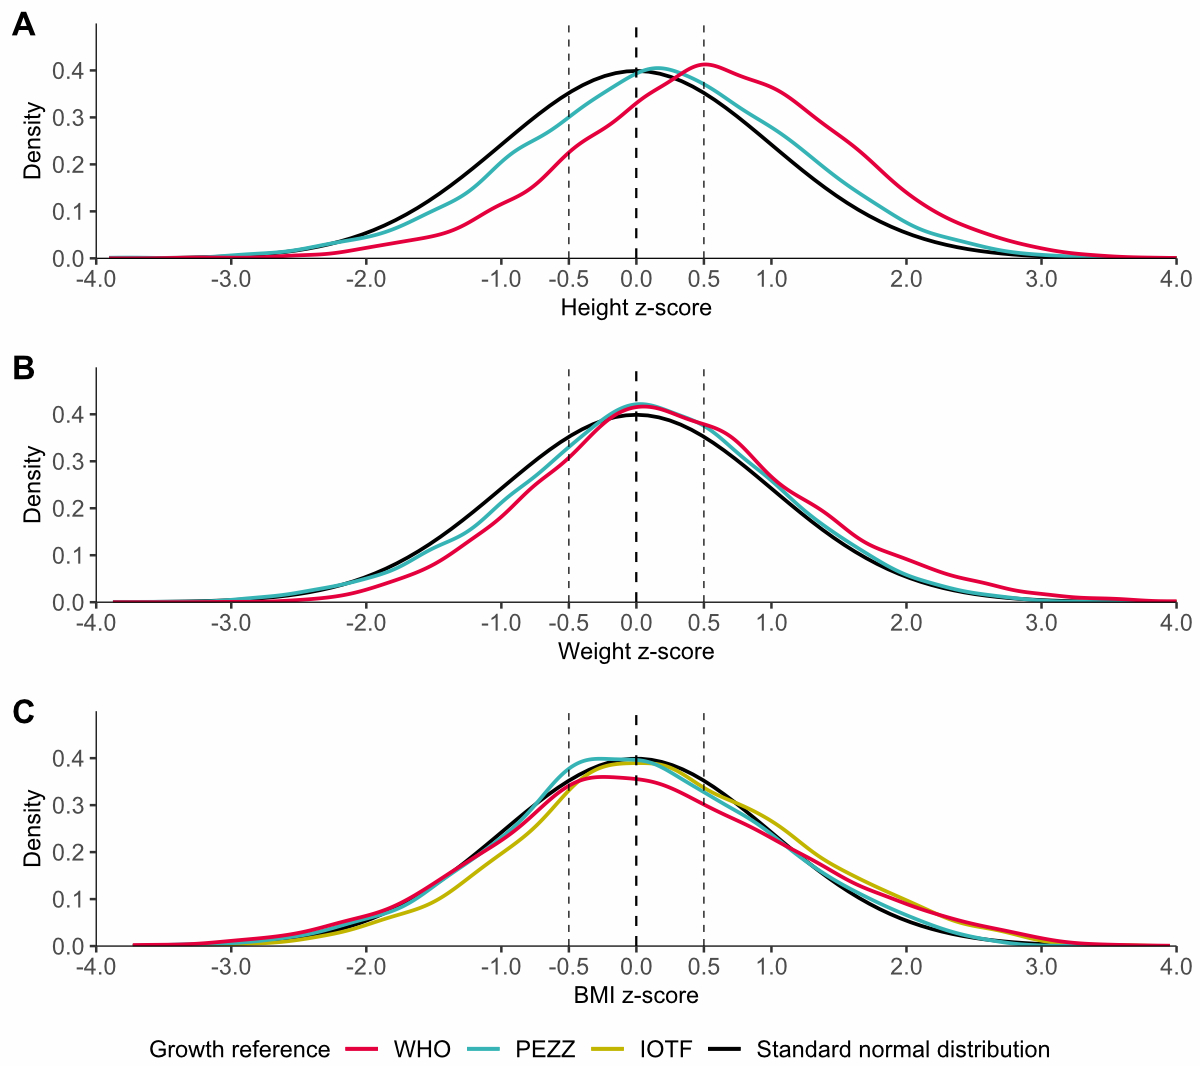
Figure 2Z-score distributions of (A) height, (B) weight and (C) body mass index (BMI) for 3755 participants of the LuftiBus in the School (LUIS) study. Z-score distributions based on World Health Organization (WHO), Paediatric Endocrinology Centre Zurich (PEZZ) and International Obesity Task Force (IOTF) references are shown versus a standard normal distribution (perfect fit).
A better fit to PEZZ compared to WHO references was also apparent from penalised cubic B-spline regression, with mean height and weight z-scores based on PEZZ references closer to the expected zero value for most ages in both boys and girls (figure 3 and appendix figure S1). Only among girls aged 17 years, for height, and 10–11 years, for weight, were the WHO mean z-scores closer to zero than z-scores derived from PEZZ references, although 95% CIs of mean z-scores from WHO and PEZZ references overlapped. Height z-scores were closer to zero among older children (>10 years) than among younger children (<8 years) for both WHO and PEZZ references. Mean BMI z-scores deviated only weakly from zero in both boys and girls for all three references. IOTF BMI z-scores were further away from zero than the WHO and PEZZ ones in older children (>12 years). The 95% CIs of locally estimated mean z-scores widened at younger and older ages due to fewer observations and boundary effects of the B-spline regression. The absolute differences between mean height, weight and BMI of children in LUIS and the 50th percentiles of PEZZ, WHO and IOTF references, as estimated by penalised cubic B-spline regression, closely mirrored the age-specific z-scores (appendix figure S2). For instance, 6-year-old girls in LUIS were, on average, 4 cm taller than the 50th percentile of PEZZ references and 6 cm taller than the 50th percentile of WHO references.
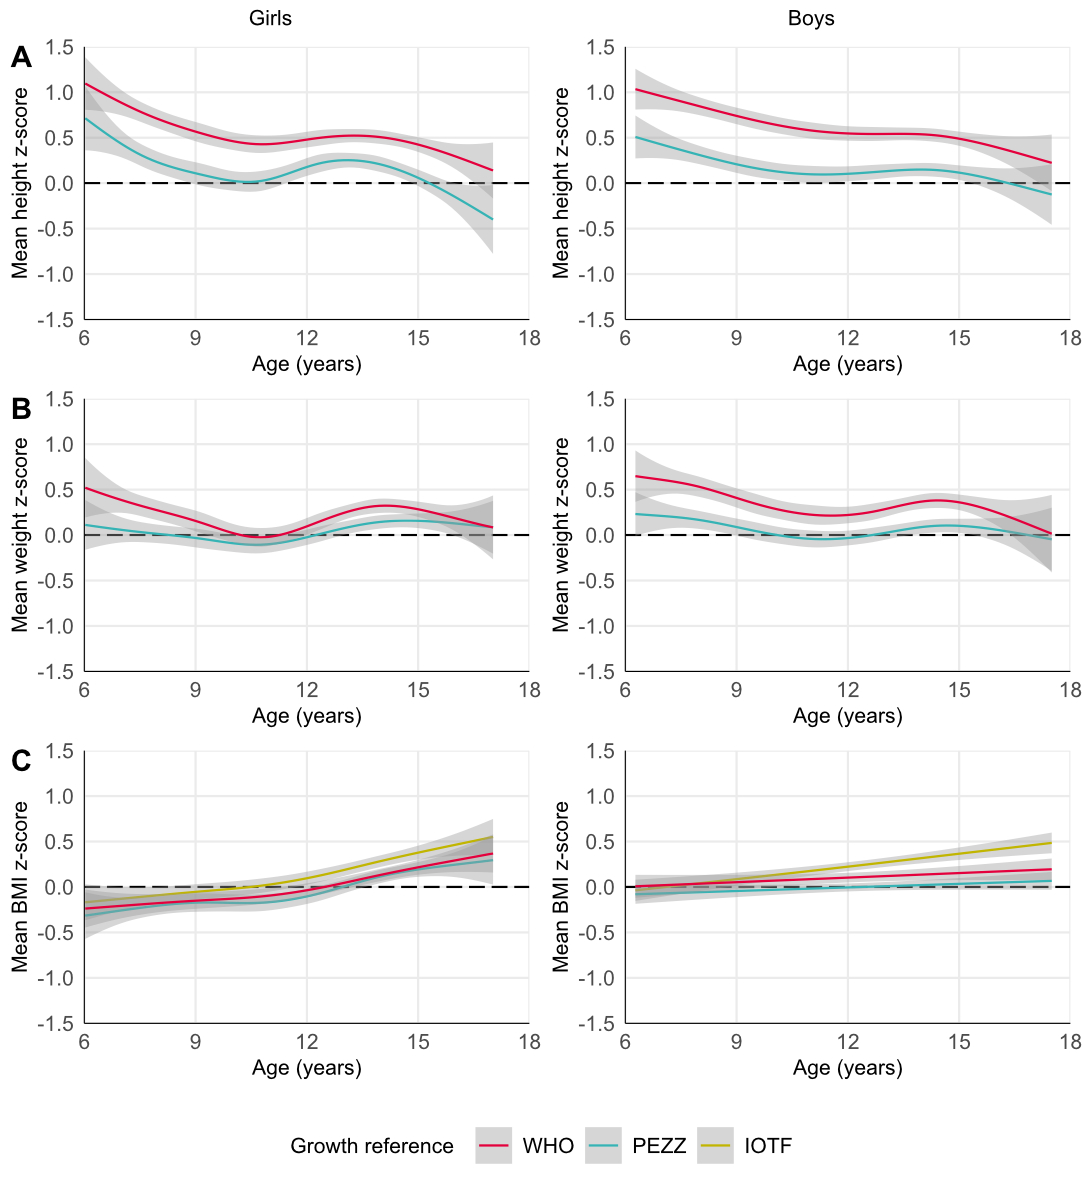
Figure 3Mean (A) height, (B) weight and (C) body mass index (BMI) z-scores over age for 3755 participants of the LuftiBus in the School (LUIS) study split by sex. Mean z-scores based on World Health Organization (WHO), Paediatric Endocrinology Centre Zurich (PEZZ) and International Obesity Task Force (IOTF) references and their 95% confidence intervals were locally estimated by penalised cubic B-spline regression on age.
Height and weight of children in LUIS fit PEZZ references better than WHO references across all strata of sex, age, origin of parents and Swiss-SEP, and in most categories of urbanisation (appendix table S3). BMI fit best to PEZZ references in girls and boys and in most categories of age, origin of parents, Swiss-SEP and degree of urbanisation.
Univariable and multivariable linear regression confirmed that height, weight and BMI z-scores of children in LUIS based on PEZZ references differ by age, origin of parents, Swiss-SEP and degree of urbanisation (appendix tables S4, S5 and S6). Height z-scores tended to decrease with age and increase with Swiss-SEP. Height z-scores were larger in children with parents born in Northern/Western Europe and Southern/Eastern Europe compared to children with parents born in Switzerland. Height z-scores were larger in children living in urban regions compared to rural regions. Weight and BMI z-scores tended to decrease with Swiss-SEP. Weight and BMI z-scores were higher in children with parents from Southern/Eastern Europe and Mixed/Other origin compared to children with parents from Switzerland. Weight and BMI z-scores were higher in children living in an urban region compared to a rural region. The linear regression did not show any differences in height, weight or BMI z-scores by sex.
Cohen’s Kappa showed substantial – but not perfect – agreement between the different growth references for BMI categories (appendix table S1). The prevalence of normal weight in LUIS children was comparable between WHO and IOTF (85%), but slightly lower for PEZZ references (81%, figure 4). The WHO classified fewer children as overweight (8%) compared to PEZZ (15%) and IOTF (13%) references. In contrast, the WHO classified more children as obese (5%) and severely obese (2%) compared to IOTF (obese 3%, severely obese: 0.3%), and more children as severely obese compared to PEZZ references (0.6%).
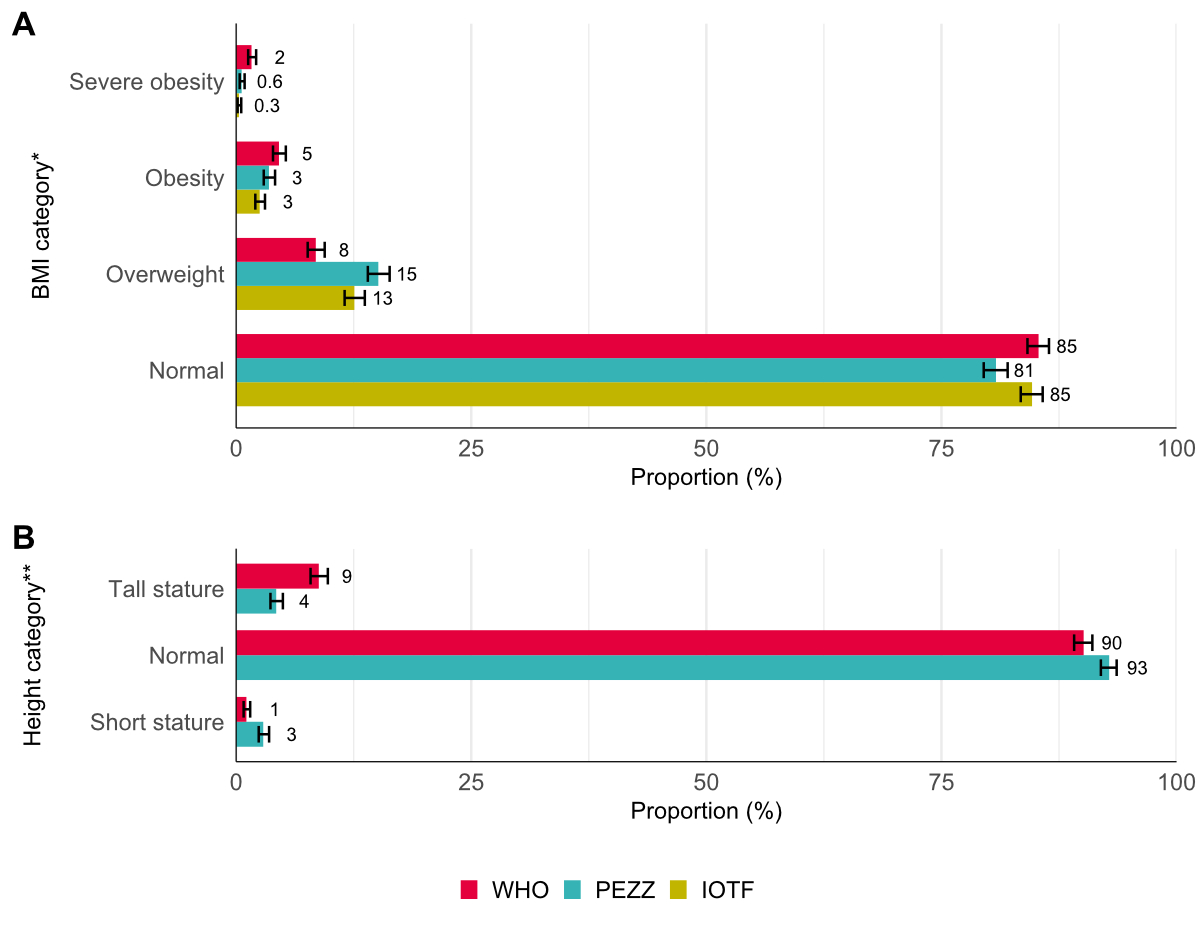
Figure 4Prevalence of (A) body mass index (BMI) and (B) height categories and their 95% CIs in 3755 participants of the LuftiBus in the school (LUIS) study. * BMI categories were defined based on cutoff values of the World Health Organization (WHO), Paediatric Endocrinology Centre Zurich (PEZZ) and International Obesity Task Force (IOTF), appendix table S1. ** Height categories were defined by percentiles: short stature (<3rd), normal (3rd to 97th) and tall stature (>97th). CI: confidence interval.
The prevalence of overweight and obesity varied across the origin of parents, Swiss-SEP and degree of urbanisation, but showed little variation between age groups or between boys and girls (appendix figure S3). We observed the following patterns regardless of the growth reference used: Overweight, obesity and severe obesity appeared to be more prevalent in children with parents of Southern/Eastern Europe or Other/Mixed origin compared to those of Swiss origin. Additionally, we observed a higher prevalence of overweight, obesity and severe obesity in the two lowest Swiss-SEP categories compared to the highest Swiss-SEP category. Overweight was more prevalent in large and small urban areas compared to rural areas. Classification into BMI categories by the three growth references had a substantial agreement across all factors (table available upon request).
The height categories differed between WHO and PEZZ references, which was reflected by only moderate agreement according to Cohen’s Kappa (figure 4 and appendix table S1). The WHO estimated fewer children as being of short stature (1%) compared to PEZZ references (3%) but estimated more children as being of tall stature (9% vs 4%). The height categories did not differ across sex, age group, origin of parents, Swiss-SEP or degree of urbanisation (appendix figure S3).
Comparing anthropometric data from LuftiBus in the School (LUIS), a population-based study of schoolchildren from the canton of Zurich, to three currently used growth references in Switzerland, this study found a poor fit to World Health Organization (WHO) and International Obesity Task Force (IOTF) growth references, while fit to Paediatric Endocrinology Centre Zurich (PEZZ) references, developed recently in the same region, Zurich and Lucerne, was better overall and within population strata. Children in LUIS were taller compared to the WHO reference population, particularly at younger ages. Children living in urban environments and those whose parents came from Northern or Western Europe were taller compared to children from rural regions and with Swiss parents. Children from urban regions, lower Swiss neighbourhood index of socioeconomic position (Swiss-SEP) index, and whose parents came from Southern or Eastern Europe had a higher BMI. Prevalence estimates of overweight, obese or short stature in LUIS differed depending on the growth references that were used to classify children.
The anthropometric data of children from the Zurich region (LUIS) differed from the WHO growth references as previously reported for this region [13]. The same has been reported in Germany [28], Austria [29] and France [30]. Improved socioeconomic and nutritional circumstances over the last century have contributed to a general increase in adult human stature across the world [9, 31], and this has been accompanied by a decrease in the age of onset of puberty [32]. Since the WHO growth references for schoolchildren and adolescents used data collected between 1963 and 1974 [7], both a secular increase in adult height and an earlier onset of puberty could explain why the children in our study (2013–2016) were taller [9, 33]. Height is strongly determined by genetic background with twin studies suggesting up to 80% heritability of body stature [34]. Adult men and women of Central and Latin American or Asian origin tend to be shorter compared to North Europeans, Central Europeans or North Americans, with a gap of up to 20 cm between the tallest and shortest populations [9]. The US studies, from which WHO references were derived, consisted of children with white (73–85%) and African-American (15–27%) ethnicity [5, 6]. In our study, 80% of the children were of European origin and 20% of mixed or unknown origin. Such differences in ethnic mix can also influence the fit of growth references. Our multivariable regression models confirmed parental origin, area-based socioeconomic status and urbanisation as significant predictors of height, weight and BMI although the models explained little of the overall variability between study participants since the adjusted R2 for the regression model was 1.3% for height, 4.4% for weight and 5.5% for BMI.
Children in LUIS were slightly taller than the population from which the PEZZ growth references were derived. LUIS included a higher proportion of children with a Swiss origin and a lower proportion of children with an Other/Mixed background than the PEZZ population (appendix table S2). However, this does not appear to explain the observed differences, as height z-scores were similar between Swiss children and those of Other/Mixed origin. However, the slightly higher socioeconomic status of children in LUIS compared to the PEZZ reference population might have contributed to the small height difference [35].
We found a clear difference in prevalence estimates of obesity, including severe obesity, depending on whether we used WHO (6%), PEZZ (4%) or IOTF (3%) references to classify children. This has also been reported for IOTF and US Centers for Disease Control and Prevention (CDC) references [36]. Prevalences of obesity, including severe obesity (3%) and overweight (13%) in LUIS, using IOTF references, were almost identical to reports of Gesundheitsförderung Schweiz: 4% obesity, including severe obesity, and 13% overweight in schoolchildren (6–16 years) in the city of Zurich for the years 2014/15 [37], which were also calculated with IOTF references. Similar to other Swiss studies [38, 39], we found that children living in lower Swiss-SEP locations, in urban areas and those whose parents originated from Southern or Eastern Europe had a higher prevalence of overweight and obesity.
Our study is limited by its regional scope, potential selection bias related to the socioeconomic status of the study population, the lack of information on pubertal stage and its initial design. We cannot extrapolate our results to all Swiss children because LUIS only includes children from the canton of Zurich, in German-speaking Switzerland. More people have a migration background in Zurich (46%) than in Switzerland as a whole (40%) [40]. Half of the study participants lived in a location in the highest Swiss-SEP quintile. Although the Swiss-SEP in LUIS (median 69, IQR 61–76) was only slightly higher than for all households in Zurich with one or more children (median 66, IQR 58–73) [15], this might differ from other regions and could have led to overestimation of height and underestimation of BMI in our study resulting in poorer fit for height references and better fit for BMI references. The primary objective of the LUIS study was to investigate lung function rather than body growth. Consequently, we did not have information on Tanner pubertal stage and could not account for puberty-related changes in growth in our analysis.
The study benefits from the population-based approach, the standardised anthropometric measurements and the incorporation of information on the origin of parents and socioeconomic status.
This study shows that growth patterns of schoolchildren in the region of Zurich do not fit well with currently used WHO references. Similarly, the BMI of Zurich schoolchildren, particularly adolescents, does not fit well with IOTF references. Poorly fitting growth references may lead to misclassification of overweight, obesity or short stature. Such misclassification can result in uncertainties in clinical decision-making including delayed treatments and unnecessary referrals [41, 42]. Additionally, it may lead to inaccurate prevalence estimates of obesity on the population level. The PEZZ growth references fit better with anthropometric measurements of Zurich schoolchildren and might reduce misclassification of obesity or short stature in this Zurich paediatric population. Nevertheless, it remains crucial for paediatricians to consider not only single measurements and cutoff values, but to rely primarily on longitudinal trajectories of height and weight and to take into account parental height, Tanner stage, bone age and medical history when determining abnormal growth [43].
Hence, new growth references representing children living in Switzerland are needed. Ideally, new Swiss growth references should be derived from nationally representative, longitudinally collected data that includes all regions of Switzerland [44]. Longitudinally collected data from primary care, hospitals (SwissPedHealth, https://sphn.ch/network/projects/project-page_nds_swisspedhealth/) and school medical services would be available and useful.
In conclusion, the WHO growth references currently used in Switzerland may lead to misclassification of overweight, obesity and short stature. Consequently, the development of new, representative national growth references is warranted.
Researchers can obtain datasets for analysis if a detailed concept sheet is presented for the planned analyses and approved by the principal investigators (Alexander Moeller, Philipp Latzin and Claudia Kuehni).
We thank the school teams and the families for participating in the study. We thank the field workers and study personnel for conducting the study. We thank Claudia Berlin and the Swiss National Cohort (SNC, https://www.swissnationalcohort.ch/) for providing data on the Swiss-SEP for the canton of Zurich. We thank the Swiss Federal Statistical Office for providing data on schools and degree of urbanisation of municipalities in the canton of Zurich.
Author contributions: Conception and design of the study: AM, PL, CK. Data entry and management: RM. Data analyses: LL (lead), FB, BS. Manuscript drafting: LL. Critical revision of the manuscript for important intellectual content: all authors. Approval of the published version of the manuscript: all authors.
The LuftiBus in the School (LUIS) study group:
Alexander Moeller, Jakob Usemann, Florian Singer: Department of Respiratory Medicine, University Children’s Hospital Zurich and Childhood Research Centre, University of Zurich, Switzerland;
Philipp Latzin and Johanna M. Kurz: Division of Paediatric Respiratory Medicine and Allergology, Department of Paediatrics, Inselspital, Bern University Hospital, University of Bern, Switzerland;
Claudia E. Kuehni, Rebeca Mozun, Cristina Ardura-Garcia, Myrofora Goutaki, Eva S.L. Pedersen and Maria Christina Mallet: Institute of Social and Preventive Medicine, University of Bern, Switzerland;
Kees de Hoogh: Swiss Tropical and Public Health Institute, Basel, Switzerland.
Lunge Zürich, Switzerland, funded study set-up, development and data collection through a grant to Alexander Moeller. This data analysis was supported through grant NDS-2021-911 (SwissPedHealth) from the Swiss Personalized Health Network (SPHN) and the Strategic Focal Area “Personalized Health and Related Technologies (PHRT)” of the ETH Domain (Swiss Federal Institutes of Technology).
All authors have completed and submitted the International Committee of Medical Journal Editors form for disclosure of potential conflicts of interest. No potential conflict of interest related to the content of this manuscript was disclosed.
1. Umer A, Kelley GA, Cottrell LE, Giacobbi P Jr, Innes KE, Lilly CL. Childhood obesity and adult cardiovascular disease risk factors: a systematic review with meta-analysis. BMC Public Health. 2017 Aug;17(1):683.
2. Horesh A, Tsur AM, Bardugo A, Twig G. Adolescent and Childhood Obesity and Excess Morbidity and Mortality in Young Adulthood-a Systematic Review. Curr Obes Rep. 2021 Sep;10(3):301–10.
3. Prader A, Largo RH, Molinari L, Issler C. Physical growth of Swiss children from birth to 20 years of age. First Zurich longitudinal study of growth and development. Helv Paediatr Acta, Suppl. 1989 Jun;52:1–125.
4. Braegger C, Jenni O, Konrad D, Molinari L. Neue Wachstumskurven für die Schweiz. Paediatrica. 2011 Jan;22(1):9–11.
5. Hamill PV, Johnston FE, Lemeshow S. Height and weight of youths 12-17 years. United States. Vital Health Stat 11. 1973 Jan;(124):1–81.
6. Abraham S, Lowenstein FW, O’Connell DE. Preliminary findings of the first health and nutrition examination survey, United States, 1971-1972: Anthropometric and clinical findings. National Center for Health Statistics (US) Division of Health Examination Statistics. 1975 Apr; DHEW publication, no. (HRA) 75-1229.
7. Hamill PV, Drizd TA, Johnson CL, Reed RB, Roche AF. NCHS growth curves for children birth-18 years. United States. Vital Health Stat 11. 1977 Nov; 165(i-iv):1-74.
8. de Onis M, Onyango AW, Borghi E, Siyam A, Nishida C, Siekmann J. Development of a WHO growth reference for school-aged children and adolescents. Bull World Health Organ. 2007 Sep;85(9):660–7.
9. NCD Risk Factor Collaboration (NCD-RisC). A century of trends in adult human height. eLife. 2016 Jul;5:e13410.
10. Natale V, Rajagopalan A. Worldwide variation in human growth and the World Health Organization growth standards: a systematic review. BMJ Open. 2014 Jan;4(1):e003735.
11. Eiholzer U, Meinhardt U. Die neuen Wachstumskurven sind für die Schweizer Kinder wahrscheinlich nicht repräsentativ. Forumnews. 2011 Sommer/11. Available from: https://www.pezz.ch/fileadmin/user_upload/Redaktion/PDFs/Wachstum_Forum_GutzumDruck_unkorrigiert.pdf
12. Jenni O, Braegger C, Konrad D, Molinari L, Kind C. Es gibt keine repräsentativen Wachstumskurven für Schweizer Kinder. Schweizerische Ärztezeitung. 2011 2011-09-07; 92(36):1393. Available from: https://www.zora.uzh.ch/id/eprint/58491/1/2011-36-660.pdf
13. Eiholzer U, Fritz C, Katschnig C, Dinkelmann R, Stephan A. Contemporary height, weight and body mass index references for children aged 0 to adulthood in Switzerland compared to the Prader reference, WHO and neighbouring countries. Ann Hum Biol. 2019 Sep;46(6):437–47.
14. Cole TJ, Lobstein T. Extended international (IOTF) body mass index cut-offs for thinness, overweight and obesity. Pediatr Obes. 2012 Aug;7(4):284–94.
15. Mozun R, Kuehni CE, Pedersen ES, Goutaki M, Kurz JM, de Hoogh K, et al.; on behalf of the LUIS study group. LuftiBus in the school (LUIS): a population-based study on respiratory health in schoolchildren. Swiss Med Wkly. 2021 Aug;151(3132):w20544.
16. Physical status: the use of and interpretation of anthropometry. WHO Technical Report Series: 854. World Health Organization, 1995. Available from: https://iris.who.int/handle/10665/37003
17. Cole TJ, Green PJ. Smoothing reference centile curves: the LMS method and penalized likelihood. Stat Med. 1992 Jul;11(10):1305–19.
18. Daymont C, Ross ME, Russell Localio A, Fiks AG, Wasserman RC, Grundmeier RW. Automated identification of implausible values in growth data from pediatric electronic health records. J Am Med Inform Assoc. 2017 Nov;24(6):1080–7.
19. Mozun R, Ardura-Garcia C, Pedersen ES, Usemann J, Singer F, Latzin P, et al. Age and body mass index affect fit of spirometry Global Lung Function Initiative references in schoolchildren. ERJ Open Res. 2022 Apr;8(2):00618-2021.
20. Binder G, Woelfle J. S1-Leitlinie Kleinwuchs. AWMF Leitlinien: Deutsche Gesellschaft für Kinderendokrinologie und -diabetologie. DGKED; 2023. Available from: https://register.awmf.org/de/leitlinien/detail/174-004
21. Standard country or area codes for statistical use (M49). United Nations, 2023. Available from: https://unstats.un.org/unsd/methodology/m49/
22. Panczak R, Berlin C, Voorpostel M, Zwahlen M, Egger M. The Swiss neighbourhood index of socioeconomic position: update and re-validation. Swiss Med Wkly. 2023 Jan;153(1):40028.
23. Urbanisierungsgrad 2011 (DEGURBA eurostat). Bundesamt für Statistik (BFS), 2020. Available from: https://www.bfs.admin.ch/asset/de/13787277
24. Scherdel P, Botton J, Rolland-Cachera MF, Léger J, Pelé F, Ancel PY, et al. Should the WHO growth charts be used in France? PLoS One. 2015 Mar;10(3):e0120806.
25. Landis JR, Koch GG. The measurement of observer agreement for categorical data. Biometrics. 1977 Mar;33(1):159–74. doi: https://doi.org/10.2307/2529310
26. Posit Team. RStudio: Integrated Development Environment for R. Posit Software, PBC, Boston, MA; 2023. https://www.posit.co/
27. R Core Team. (2022). R: A language and environment for statistical computing. R Foundation for Statistical Computing. Vienna, Austria; 2023. https://www.R-project.org/
28. Rosario AS, Schienkiewitz A, Neuhauser H. German height references for children aged 0 to under 18 years compared to WHO and CDC growth charts. Ann Hum Biol. 2011 Mar;38(2):121–30.
29. Gleiss A, Lassi M, Blümel P, Borkenstein M, Kapelari K, Mayer M, et al. Austrian height and body proportion references for children aged 4 to under 19 years. Ann Hum Biol. 2013 Jul;40(4):324–32.
30. Heude B, Scherdel P, Werner A, Le Guern M, Gelbert N, Walther D, et al. A big-data approach to producing descriptive anthropometric references: a feasibility and validation study of paediatric growth charts. Lancet Digit Health. 2019 Dec;1(8):e413–23.
31. Cole TJ. Secular trends in growth. Proc Nutr Soc. 2000 May;59(2):317–24.
32. Herman-Giddens ME. Recent data on pubertal milestones in United States children: the secular trend toward earlier development. Int J Androl. 2006 Feb;29(1):241–6.
33. Bellis MA, Downing J, Ashton JR. Adults at 12? Trends in puberty and their public health consequences. J Epidemiol Community Health. 2006 Nov;60(11):910–1.
34. Perola M, Sammalisto S, Hiekkalinna T, Martin NG, Visscher PM, Montgomery GW, et al.; GenomEUtwin Project. Combined genome scans for body stature in 6,602 European twins: evidence for common Caucasian loci. PLoS Genet. 2007 Jun;3(6):e97.
35. Batty GD, Shipley MJ, Gunnell D, Huxley R, Kivimaki M, Woodward M, et al. Height, wealth, and health: an overview with new data from three longitudinal studies. Econ Hum Biol. 2009 Jul;7(2):137–52.
36. Zimmermann MB, Gübeli C, Püntener C, Molinari L. Detection of overweight and obesity in a national sample of 6-12-y-old Swiss children: accuracy and validity of reference values for body mass index from the US Centers for Disease Control and Prevention and the International Obesity Task Force. Am J Clin Nutr. 2004 May;79(5):838–43.
37. Stamm H, Bauschatz AS, Ceschi M, Guggenbühl L, Lamprecht M, Ledergerber M, et al. Vergleichende Auswertung der Daten des Schuljahres 2014/2015. Monitoring der Gewichtsdaten der schulärztlichen Dienste der Städte Basel, Bern und Zürich: Bern und Lausanne: Gesundheitsförderung Schweiz, 2016. Available from: https://gesundheitsfoerderung.ch/node/1174
38. Stamm H, Bürgi R, Lamprecht M, Walter S. Analyse von Daten aus den Kantonen Aargau, Basel-Stadt, Genf, Graubünden, Jura, Luzern, Obwalden, St. Gallen und Uri sowie den Städten Bern, Freiburg, Winterthur und Zürich. Vergleichendes Monitoring der Gewichtsdaten von Kindern und Jugendlichen in der Schweiz: Bern und Lausanne: Gesundheitsförderung Schweiz, 2021. Available from: https://gesundheitsfoerderung.ch/sites/default/files/2023-01/Arbeitspapier_058_GFCH_2021-09_-_Vergleichendes_BMI-Monitoring.pdf
39. Eiholzer U, Fritz C, Stephan A. The increase in child obesity in Switzerland is mainly due to migration from Southern Europe - a cross-sectional study. BMC Public Health. 2021 Jan;21(1):243.
40. Bevölkerung nach Migrationsstatus. Bundesamt für Statistik (BFS), 2022. Available from: https://www.bfs.admin.ch/bfs/de/home/statistiken/bevoelkerung/migration-integration/nach-migrationsstatuts.html
41. Wright C, Lakshman R, Emmett P, Ong KK. Implications of adopting the WHO 2006 Child Growth Standard in the UK: two prospective cohort studies. Arch Dis Child. 2008 Jul;93(7):566–9.
42. Júlíusson PB, Roelants M, Hoppenbrouwers K, Hauspie R, Bjerknes R. Growth of Belgian and Norwegian children compared to the WHO growth standards: prevalence below -2 and above +2 SD and the effect of breastfeeding. Arch Dis Child. 2011 Oct;96(10):916–21.
43. A health professional’s guide for using the new WHO growth charts. Paediatr Child Health. 2010 Feb;15(2):84–98.
44. Wachstumskurven anpassen oder nicht? Press release: pädiatrie schweiz; 22. Available from: https://www.paediatrieschweiz.ch/news/wachstumskurven/
The appendix is available in the pdf version of the article at https://doi.org/10.57187/s.3834.