Figure 1Concerns about the pandemic and its consequences.
DOI: https://doi.org/https://doi.org/10.57187/s.3578
Audit of diabetes-dependent quality of life
Alcohol Use Disorders Identification Test Consumption
continuous glucose monitoring
flash glucose monitoring
General Anxiety Disorder
information technology
mental component summary (SF-12 questionnaire)
principal component analysis
physical component summary (SF-12 questionnaire)
Primary Care Evaluation of Mental Disorders
Short-Form 12
During the COVID-19 pandemic, many countries imposed lockdowns to contain and prevent virus spread [1]. In addition, the majority of high-income countries established various other preventive measures, such as social distancing, quarantines, restrictions on large events and mass gatherings, school closures, and mandates on working from home. Similar measures were implemented in Switzerland, even in the absence of strict and general lockdowns. In some countries, the pandemic was associated with increased incidence of stress, anxiety, and depression, as well as reduced levels of exercise and frequent snacking among the population [2–5]. Weight gain was reported in several countries [6–8], including Switzerland, with a 3 kg increase in body weight over the pandemic reported in all age groups [9]. This pandemic period was even more stressful for people living with diabetes, being classified as high risk for developing more severe forms of COVID-19. Reduction in physical activity [2, 10–16], weight gain [2, 12, 16], difficulties in diabetes management, and reduced access to medications and specialised care providers have all been reported in this population [10–12, 14, 17–19]. Together, these changes resulted in the deterioration of glucose control and adverse metabolic outcomes [10, 12, 20]. Stress, depression and anxiety also increased in patients living with diabetes, contributing to difficulties in the daily care routine [2, 14, 16].
In countries with easy and comprehensive access to care, including Switzerland, limited data is available other than for the paediatric population [21]. Therefore, we aimed to assess the perception of adults with diabetes on their care and health during the COVID-19 pandemic in the canton of Vaud, Switzerland, using data from the CoDiab-VD cohort. To achieve this, we aimed to describe the effects of the pandemic on various aspects of diabetes care, in particular relating to cancellation or postponement, changes in daily diabetes management, and psychosocial burden, and to explore factors associated with six COVID-19 outcomes related to these domains.
We used cross-sectional data from the 2021 follow-up survey of the CoDiab-VD cohort [22]. This cohort of people living with diabetes was recruited through community pharmacies in 2011–12 and 2017. The group was followed up annually until 2017, and then every 2 years, by postal questionnaires sent to participants' homes [23, 24]. The inclusion criteria at recruitment were being a noninstitutionalised adult (≥18 years) with a diagnosis of diabetes of any type for at least one year, and living in the canton of Vaud, Switzerland. Individuals with cognitive impairment or poor French proficiency and women with gestational diabetes were excluded from the study. Among the 1033 participants recruited in 2011–12 (n = 519) and 2017 (n = 514), 714 were still registered in the cohort in 2021 and were sent the follow-up questionnaire. The attrition of the cohort from 2011–2012 was due to 15 lost to follow-up, 232 drop-outs, and 72 deaths.
Core questions addressed different aspects of diabetes and diabetes care, as well as participants’ characteristics [24]. In addition, questions relating to the COVID-19 pandemic were added to two subsections, the first regarding the experiences of diabetes care during the pandemic, and the second concerning COVID-19 infection and vaccination, and the psychosocial burden of the pandemic.
For the present study, data collected in the questionnaire section related to COVID-19 and that on participants’ characteristics was used. The variables are briefly described in table 1 and detailed (questions and response modalities) in table S1 in the appendix for the COVID-19 section; information on the core questions are published elsewhere [24].
Table 1Description of variables. Detailed questions and response modalities can be found in table S1 in the appendix.
| Questions on the COVID-19 pandemic in relation to diabetes | |
| Access to diabetes care | Cancellation or postponement of diabetes-related care |
| Physical and emotional impact of this cancellation or postponement | |
| Access to diabetes-specific medication or materials before and during the pandemic | |
| Daily diabetes management | Changes in the management of diabetes on a daily basis, including lifestyle habits and diabetes medication |
| Effects on glucose control and weight since the beginning of the pandemic | |
| Hyper- and hypoglycaemia | Changes in the frequency and severity of hyper- and hypoglycaemia since the beginning of the pandemic |
| Need for emergency care or hospitalisation related to dysglycaemia | |
| Questions about the pandemic in general (i.e., not specifically linked to diabetes) | |
| COVID-19 infection and vaccination | Positive test |
| Hospitalisation because of COVID-19 | |
| Vaccination against COVID-19 or intention to be vaccinated | |
| Worries about the pandemic and its consequences | Degree of stress or worry caused by the pandemic |
| Concerns about and impact of the pandemic on different life aspects (health, social life, family life, leisure and lifestyle, work situation, and financial situation) | |
| Feelings since the beginning of the pandemic (excluded or left out, isolated from others, and alone with diabetes) | |
| Remote consultations since the beginning of the COVID-19 pandemic | Use of telemedicine with healthcare professional |
| Mode of consultation (phone, video, email, and short message) | |
| Information technology (IT) tools | Ease of use of computer, touch screens |
| Searching for information on the internet. | |
| Participants’ characteristics | |
| Sociodemographic and socioeconomic characteristics | Age |
| Sex | |
| Education | |
| Living status | |
| Financial hardship [36] | |
| Mandatory health insurance scheme | |
| Cantonal subsidy for mandatory health insurance. | |
| Diabetes | Self-reported type of diabetes |
| Self-reported antidiabetic medication | |
| Health status | Self-perceived health using the first question of the SF-12 [37] |
| Body mass index (in kg/m2) | |
| Number of diabetes-related complications | |
| Number of comorbidities | |
| Depression questionnaire [38] | |
| General anxiety disorder (GAD-7) questionnaire [39] | |
| Health habits | Smoking status |
| Alcohol consumption using the Alcohol Use Disorders | |
| Identification Test Consumption (AUDIT-C) questionnaire [40] | |
| Physical activity [41] | |
| Self-efficacy | Stanford diabetes self-efficacy scale |
| Quality of life | Health-related quality of life using the Short-Form 12 (SF-12) questionnaire with mental and physical component summaries (MCS and PCS, respectively) [37] |
| Diabetes-specific quality of life using the Audit of Diabetes-Dependent Quality of Life (ADDQoL) questionnaire [42] | |
| Health services utilisation in the last 12 months | Hospitalisation |
| Emergency visit | |
| Home care services, domestic home support | |
| Influenza vaccination | |
| Diet advice by a healthcare professional | |
| Physical activity advice by a healthcare professional | |
ADDQoL: Audit of diabetes-dependent quality of life; GAD-7: general anxiety disorder; QoL: quality of life; SF-12 MCS: Short-Form 12 mental component summary; SF-12 PCS: Short-Form 12 physical component summary.
First, descriptive analysis was conducted to present the characteristics of the participants and the results of the COVID-19 section of the questionnaire. Continuous parameters and parameters measured through a Likert scale were summarised with their mean and standard deviation (SD), while categorical variables were summarised with their relative frequency (percentage).
To further investigate themes in the COVID-19 section, we used principal component analysis (PCA) [25] to reduce the number of considered outcomes. Principal component analysis is a data-reduction technique that investigates the underlying structure of scales including several items, allowing a large amount of data to be summarised using a smaller set of components. The aim of principal component analysis was to aggregate items measuring the same dimension and reduce the number of variables included in the multivariable analyses, without overlooking important information. Eigenvalues higher than one and scree plots were used to determine the number of components to be considered in each analysis. Decisions to aggregate items measuring the same component were supported by correlation analysis and calculation of Cronbach’s alpha [26]. Usual thresholds and procedures were used [27]. We performed principal component analysis on each of the three scales included in the subsection “Worries about the pandemic and its consequences,” and on the scale in the section “Information technology (IT) tools” (for details, see table S2 in the appendix). Thus, we obtained five components (identified in brackets): a single component summarising the six aspects of the pandemic causing concern for respondents (Concerns about the pandemic); a single component summarising the six aspects of life impacted by the pandemic (Impact of the pandemic); two different components summarising feelings about the pandemic (one including three general questions on loneliness (Loneliness), and one including two questions relating to diabetes (Loneliness related to diabetes); and a final component summarising three questions about IT use (Comfortable with IT). The first four components were used as outcomes, and the final component was used as an independent variable for further analyses.
We then carried out exploratory multivariable analyses to identify factors associated with six COVID-19-related outcomes: (1.) diabetes care cancelled or postponed (1 yes vs 0 no); (2.) physical activity management (1 more difficult vs 0 neither more difficult nor easier, and easier); (3.) loneliness related to diabetes (1 sometimes and often lonely vs 0 never and rarely lonely); (4.) concerns about the pandemic (continuous range, 1 not concerned to 3 very concerned); (5.) impact of the pandemic (continuous range, 1 not impacted to 3 much impacted); and (6.) loneliness (continuous range, 1 never felt lonely to 4 often felt lonely). Loneliness related to diabetes was recorded as a binary outcome because of the underrepresentation of certain score categories. Logistic regressions were used for binary outcomes, and linear regressions were used for continuous outcomes. For all models, a stepwise backward-forward selection of variables was performed, based on the Akaike information criterion [28]. Akaike information criterion was preferred to the Bayesian information criterion because of its less conservative power of selection. Statistical significance tests applied to the estimated coefficients of the models guided the variable selection process. While statistical significance indicates the presence of an association between variables, it is important to note that the strength of the association is not solely determined by statistical significance. Rather, the inclusion of variables in the models was based on their contribution to model fit, as assessed by the Akaike information criterion. In addition to estimating associations through regression models, precision was considered by providing confidence intervals for relevant estimates, where applicable. Stepwise variable selection, while commonly employed for model building, has inherent limitations that must be taken into consideration. The selected variables reflect statistical associations rather than direct causal relationships. The variables included in the models differed for analyses on binary or continuous outcomes. For binary outcomes, the small number of cases did not allow the inclusion of all candidate variables in the logistic regression model, because of insufficient statistical power. Therefore, we selected variables based on expert knowledge for the three binary outcomes (for details, see table S3 in the appendix). For continuous outcomes, we tested all variables selected in the models. Regarding multicollinearity, we computed independence and correlation tests, as well as the variance inflation factor, to identify possible collinear explanatory variables. Assumptions of the linear models have been inspected and are met. For each logistic model, we measured the goodness of fit with the Hosmer-Lemeshow test, the McFadden pseudo-R squared, and the McFadden adjusted pseudo-R squared. For both types of regression model, we considered all patients with complete data. The number of observations is the same for all outcomes. No imputation was made for missing data.
All statistical analyses were performed using Stata 17 [29] and the R statistical environment version 4.1.3 [30], with a significance level set at 5%.
The protocol of the CoDiab-VD study was approved by the Ethics Committee of Research on Human Beings of the Canton of Vaud (CER-VD, protocol numbers 151/11 and PB_2017_00232). CoDiab-VD is registered with ClinicalTrials.gov, identifier NCT01902043. Written informed consent was obtained from all participants, and data were kept confidential.
In late October 2021, the follow-up questionnaire was sent to the 714 participants still enrolled in CoDiab-VD; of these participants, 566 (79.3%) completed and returned the self-administered paper-based questionnaire before the end of January 2022 and were included in the analyses.
Respondents’ characteristics are presented in table 2. Briefly, the mean age was approximately 70 years, men were more represented (57%) than women, and a third of the study participants lived alone. Type 2 diabetes was predominant (73%), and most respondents were taking antidiabetic medications, including injected medications (62%).
Table 2Characteristics of the participants (n = 566).
| n (%) or mean (SD; min-max) | (Total respondents) | |||
| Sociodemographic and socioeconomic status | Age, years | 69.6 (11.6; 22–94) | (566) | |
| Sex, female | 242 (42.8) | (566) | ||
| Education | (534) | |||
| Primary | 72 (13.5) | |||
| Secondary | 292 (54.7) | |||
| Tertiary | 170 (31.8) | |||
| Living status | (554) | |||
| Lived alone | 196 (35.4) | |||
| Lived with other people | 358 (64.6) | |||
| Financial hardship | 113 (21.1) | (536) | ||
| Mandatory health insurance scheme | (541) | |||
| Standard insurance model | 327 (60.4) | |||
| Alternative insurance model | 214 (39.6) | |||
| Received cantonal subsidy for mandatory health insurance | 184 (33.8) | (545) | ||
| Diabetes | Self-reported type of diabetes | (566) | ||
| Type 2 | 411 (72.6) | |||
| Type 1 | 66 (11.7) | |||
| Other | 89 (15.7) | |||
| Antidiabetic medication including insulin or other injectable | 345 (62.1) | (556) | ||
| Health status | Self-perceived health | (559) | ||
| Very good and excellent | 87 (15.6) | |||
| Good | 342 (61.1) | |||
| Poor and medium | 130 (23.3) | |||
| Body mass index (kg/m2) | (547) | |||
| Underweight and normal (BMI <24.9) | 130 (23.8) | |||
| Overweight (BMI 25–29.9) | 219 (40.0) | |||
| Obese (BMI ≥30) | 198 (36.2) | |||
| Number of diabetes-related complications* | 0.6 (0.9; 0–5) | (542) | ||
| Number of comorbidities** | 1.7 (1.3; 0–6) | (553) | ||
| Depression | 186 (33.2) | (560) | ||
| GAD-7 | (519) | |||
| Minimal to mild symptoms (score 0–9) | 473 (91.1) | |||
| Moderate to severe symptoms (score 10–21) | 46 (8.9) | |||
| Health habits | Current smoker | 94 (16.9) | (556) | |
| Risky or excessive alcohol consumption (AUDIT-C questionnaire, score ≥4 for men, ≥3 for women) | 200 (37.1) | (539) | ||
| Physically inactive | 176 (32.1) | (549) | ||
| Outcomes of care | Stanford self-efficacy (global score) | 8.0 (1.7; 1.5–10.0) | (541) | |
| Quality of life | SF-12 MCS (0–100 best) | 46.7 (11.3; 12.5–69.1) | (549) | |
| SF-12 PCS (0–100 best) | 42.9 (10.6; 11.6–62.8) | (548) | ||
| ADDQoL (global score, −9 to +3 least impact of diabetes on QoL) | −1.3 (1.6; −8.8–0.0) | (564) | ||
| Health services utilisation (last 12 months) | Hospitalisation, at least once | 146 (26.5) | (551) | |
| Emergency/unscheduled visit, at least once | 169 (30.4) | (556) | ||
| Used home care services temporarily or regularly | 76 (13.7) | (556) | ||
| Used domestic home support temporarily or regularly | 59 (10.5) | (558) | ||
| Received diet advice from a healthcare professional | 209 (37.3) | (560) | ||
| Received physical activity advice from a healthcare professional | 272 (48.8) | (557) | ||
| Seasonal influenza vaccination | 343 (61.9) | (554) | ||
ADDQoL: Audit of diabetes-dependent quality of life; BMI: body mass index; GAD-7: general anxiety disorder; Min: minimum; Max: maximum; QoL: quality of life; SD standard deviation; SF-12 MCS: Short-Form 12 mental component summary; SF-12 PCS: Short-Form 12 physical component summary.
* List of diabetes-related complications: myocardial infarction/angina, stroke, retinopathy, nephropathy, neuropathy, severe hypo- or hyperglycaemia.
** List of comorbidities: heart failure, valvulopathy, hypertension, hyperlipidemia, chronic respiratory conditions, peptic ulcer, osteoporosis, osteoarthritis, Parkinson's disease, malignancy, depression, other chronic conditions
A tenth of participants reported having had diabetes-related care cancelled or postponed (table 3) during the pandemic, the majority of which were consultations with healthcare professionals (diabetologists, general practitioners, or other professionals). Outpatient or inpatient procedures were rarely cancelled or postponed (data not illustrated). According to the respondents, this cancellation or postponement had few negative effects on their physical and mental well-being; three-quarters reported not having been impacted at all in terms of their physical well-being, and two-thirds reported not having been impacted at all in terms of their mental well-being. Access to diabetes-specific medications or materials was reported as no more difficult during the COVID-19 pandemic than before (table 3).
Table 3Care and health of adults with diabetes in time of COVID-19 pandemic (n = 566).
| n (%) | (Total respondents) | ||
| Access to care | |||
| Diabetes-related care cancelled or postponed | 61 (11.2) | (545) | |
| Negative impact of the cancellation/postponement on physical well-being | (59) | ||
| Not at all | 43 (72.9) | ||
| Yes, to some extent | 13 (22.0) | ||
| Yes, completely | 3 (5.1) | ||
| Impact of the cancellation/postponement on mental well-being | (59) | ||
| Not at all | 38 (64.4) | ||
| Yes, to some extent | 17 (28.8) | ||
| Yes, completely | 4 (6.8) | ||
| Access to diabetes-specific medications or materials… | |||
| … before the COVID-19 pandemic | (546) | ||
| Very easy | 392 (71.8) | ||
| Easy | 107 (19.6) | ||
| Neither easy nor difficult | 45 (8.2) | ||
| Difficult | 0 (0.0) | ||
| Very difficult | 2 (0.4) | ||
| … during the COVID-19 pandemic | (545) | ||
| Very easy | 345 (63.3) | ||
| Easy | 126 (23.1) | ||
| Neither easy nor difficult | 61 (11.2) | ||
| Difficult | 9 (1.7) | ||
| Very difficult | 4 (0.7) | ||
| All needed information about COVID-19 and the risk of developing a severe form of the disease obtained from the physician | (547) | ||
| Yes, completely | 283 (51.7) | ||
| Yes, to some extent | 149 (27.2) | ||
| No | 115 (21.0) | ||
| Daily diabetes management | |||
| Since the beginning of the pandemic, difficulty in managing diabetes daily was | (557) | ||
| More difficult | 5 (0.9) | ||
| Neither more difficult nor easier | 543 (97.5) | ||
| Easier | 9 (1.6) | ||
| Since the beginning of the pandemic, following an appropriate diet was | (552) | ||
| More difficult | 10 (1.8) | ||
| Neither more difficult nor easier | 536 (97.1) | ||
| Easier | 6 (1.1) | ||
| Since the beginning of the pandemic, being physically active was | (555) | ||
| More difficult | 91 (16.4) | ||
| Neither more difficult nor easier | 455 (82.0) | ||
| Easier | 9 (1.6) | ||
| Since the beginning of the pandemic, taking diabetes medication was | (557) | ||
| More difficult | 0 (0.0) | ||
| Neither more difficult nor easier | 551 (98.9) | ||
| Easier | 6 (1.1) | ||
| Since the beginning of the pandemic, weight modification (for whatever reason) | (554) | ||
| Weight gain; n (%) (median; p25–p75 [kg]) | 89 (16.1) (4; 3–6) | ||
| Weight loss; n (%) (median; p25–p75 [kg]) | 103 (18.6) (5; 3–10) | ||
| No change | 346 (62.5) | ||
| Self-monitoring of blood glucose | 478 (85.7) | (558) | |
| Device used for blood glucose monitoring | (473) | ||
| Blood glucose meter | n = 363 | ||
| Continuous glucose monitoring or flash glucose monitoring | n = 118 | ||
| Insulin pump combined with continuous glucose monitoring | n = 14 | ||
| Frequency of blood glucose monitoring during the pandemic | (474) | ||
| Less frequent than usual | 30 (6.3) | ||
| As usual | 425 (89.7) | ||
| More frequent than usual | 19 (4.0) | ||
| Variation of blood glucose values during the pandemic | (556) | ||
| More variable than usual | 71 (12.8) | ||
| Same as usual | 432 (77.7) | ||
| More stable than usual | 16 (2.9) | ||
| Do not know | 37 (6.7) | ||
| Hyperglycaemia and hypoglycaemia | |||
| Compared to before the pandemic, experienced: | |||
| Hyperglycaemia | (550) | ||
| Less often | 13 (2.4) | ||
| Neither less often nor more often | 409 (74.4) | ||
| More often | 35 (6.4) | ||
| Do not know | 93 (16.9) | ||
| Hypoglycaemia | (552) | ||
| Less often | 17 (3.1) | ||
| Neither less often nor more often | 428 (77.5) | ||
| More often | 20 (3.6) | ||
| Do not know | 87 (15.8) | ||
| Since the beginning of the pandemic: | |||
| Had to seek emergency care for hyperglycaemia | 6 (1.1) | (553) | |
| Was hospitalised for hyperglycaemia | 2 (0.4) | (552) | |
| Had to seek emergency care for hypoglycaemia | 5 (0.9) | (553) | |
| Was hospitalised because of hypoglycaemia | 1 (0.2) | (552) | |
| Infection and vaccination against COVID-19 | |||
| Positive COVID-19 test (PCR or rapid antigen test) | 65 (11.8) | (552) | |
| Hospitalised because of COVID-19 | 12 (18.5) | (65) | |
| Vaccinated against COVID-19 (at least one dose) | 518 (93.8) | (552) | |
| If not already done at survey time, intention to be vaccinated against COVID-19 | 3 (8.6) | (35) | |
| Worries about the pandemic and its consequences | |||
| Degree of stress or worry caused by the pandemic | (551) | ||
| 0 – not at all stressed or worried | 54 (9.8) | ||
| 1 | 35 (6.4) | ||
| 2 | 52 (9.4) | ||
| 3 | 42 (7.6) | ||
| 4 | 42 (7.6) | ||
| 5 | 94 (17.1) | ||
| 6 | 40 (7.3) | ||
| 7 | 58 (10.5) | ||
| 8 | 85 (15.4) | ||
| 9 | 23 (4.2) | ||
| 10 – very stressed or worried | 26 (4.7) | ||
Concerning the daily management of diabetes since the beginning of the pandemic, no striking differences were reported in the difficulty of performing daily management routines, following an appropriate diet, or taking medications. In contrast, being physically active was reported as more difficult by 16% of the respondents (table 3).
When participants were asked about the frequency with which they experienced episodes of hyperglycaemia or hypoglycaemia compared to the pre-pandemic period, few reported having had more frequent episodes of hyperglycaemia (6%) or hypoglycaemia (4%) during the COVID-19 period. Because of hyperglycaemia, approximately 1% had to seek emergency care, and 0.4% required hospitalisation. For hypoglycaemia, these proportions were similar, with approximately 1% seeking emergency care and 0.2% being hospitalised (table 3).
Since the beginning of the pandemic, 11.8% of the respondents (n = 552) had had a positive COVID-19 test using PCR or rapid antigen testing at the time of the survey (October 2021 – January 2022); and 12 of these 65 respondents had been hospitalised due to COVID-19. Vaccination was very common, with more than 90% of respondents having received at least one dose; two-thirds of the 35 unvaccinated individuals did not intend to receive the vaccine (table 3).
When participants reported the level of stress or worry they had felt about the pandemic on a scale from 0 (not at all) to 10 (very), one-third had not been worried (0–3, 33.2%), one-third had been somewhat worried (4–6, 31.9%), and one-third had been very worried (7–10, 34.9%) (table 3).
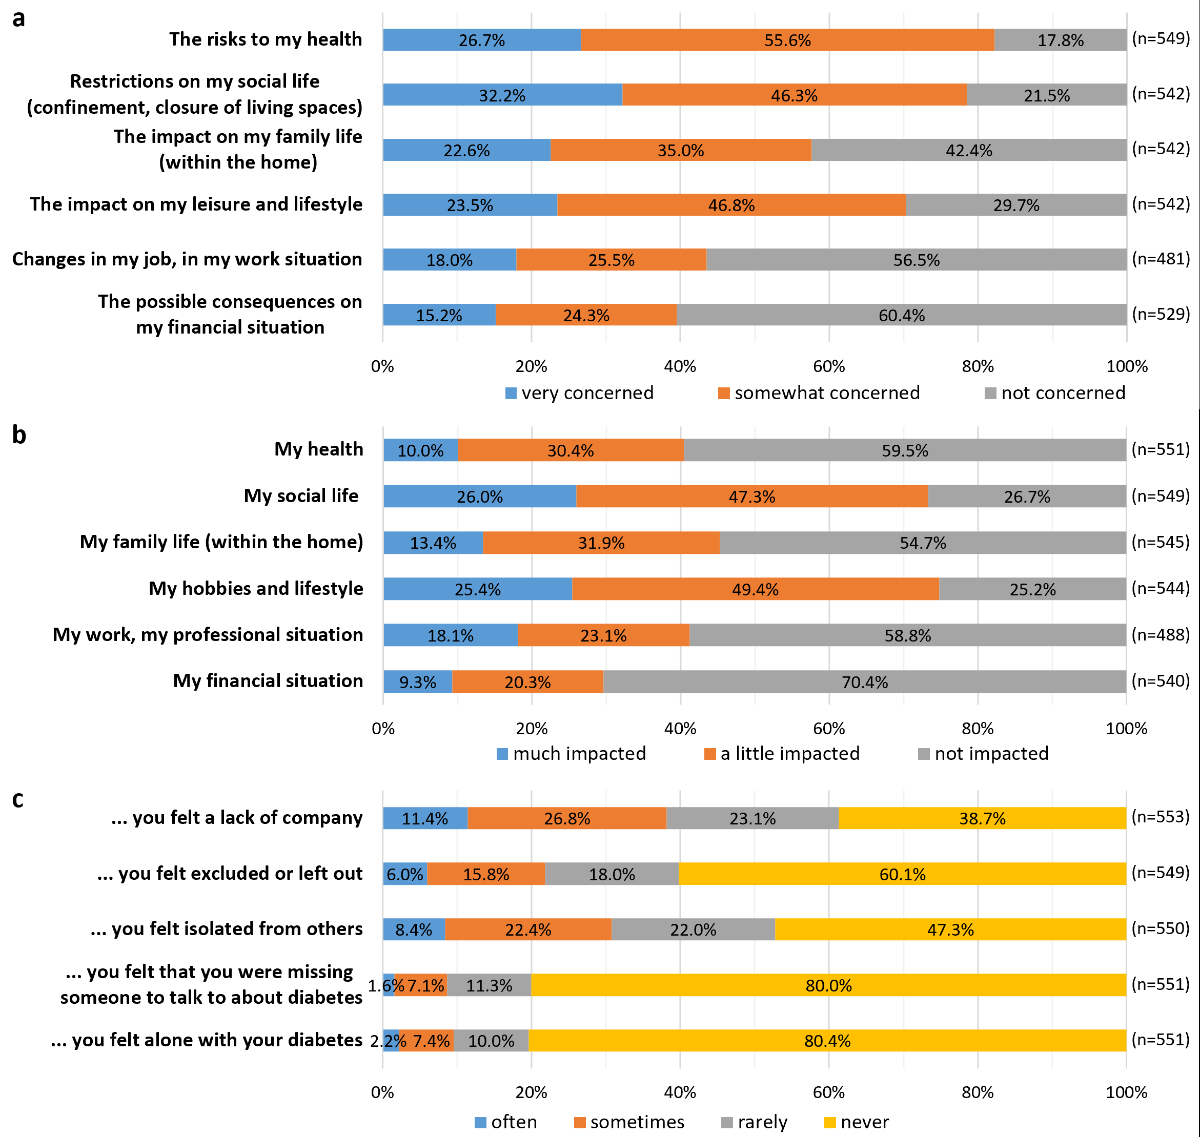
The participants were most concerned about the restrictions on their social life and the risks to their health (figure 1A). Aspects of their lives more impacted by the pandemic were social life, hobbies, and lifestyle (figure 1B). In terms of loneliness related to diabetes, fewer than 10% of the respondents reported often or sometimes missing someone to talk about their condition, or feeling alone with their diabetes since the beginning of the pandemic (figure 1C).
Figure 1Concerns about the pandemic and its consequences.
One in six respondents had consulted a healthcare professional remotely during the pandemic. The main types of consultations were conducted by phone (n = 69) or email (n = 22), followed by SMS (n = 10) and video (n = 5). Most remote consultations were with a general practitioner (n = 42) or a diabetologist (n = 42); other healthcare professionals were less frequently consulted remotely, including diabetes nurses (n = 8), dieticians (n = 3), psychologists/psychiatrists (n = 10), and others (n = 13). Approximately 60% of the participants generally felt comfortable using a computer, two-thirds felt comfortable using a touch screen, and two-thirds felt comfortable searching for information on the internet (data not illustrated).
Multivariable analyses of the three binary outcomes are presented in table 4:
Diabetes-related care cancelled or postponed: having more diabetes-related complications, a higher anxiety (GAD-7) score, and having had remote consultations were all significantly associated with cancelled or postponed diabetes care.
Physical activity management: variability in blood glucose values, having had remote consultations, and having received dietary advice significantly increased the odds of having more difficulties in physical activity management. In contrast, a higher score in the physical component of the short-form 12 (SF-12) (physical component summary [PCS]) and having received physical activity advice decreased the odds of having increased difficulty in managing physical activity.
Loneliness related to diabetes:Higher scores in the mental and physical components of the SF-12 (mental component summary [MCS] and PCS), higher scores of diabetes-related quality of life (ADDQoL), and being comfortable using IT tools all decreased the odds of feeling lonely about one's diabetes.
Table 4Factors associated with dichotomous COVID-19-associated outcomes (logistic regression models; n = 325). In bracket, baseline or increment. Final regression models are presented without other adjustement for potential confounding variables.
| OR | 95% CI | p value | ||
| Diabetes related care cancelled or postponed (1 yes vs 0 no) | Age (per one year increase) | 0.68 | (0.44–1.03) | 0.072 |
| Lived with other people (vs lived alone) | 0.47 | (0.19–1.15) | 0.096 | |
| Standard mandatory health insurance scheme (vs alternative insurance scheme) | 2.11 | (0.92–5.15) | 0.086 | |
| Received subsidies for health insurance (vs did not) | 2.13 | (0.87–5.33) | 0.099 | |
| Complications (per one more complication) | 1.97 | (1.37–2.88) | <0.001 | |
| Vaccinated against COVID-19 (vs not) | 0.30 | (0.08–1.12) | 0.060 | |
| GAD-7 moderate to severe symptoms (vs minimal to mild symptoms) | 3.45 | (1.23–9.31) | 0.015 | |
| Somewhat to completely comfortable with IT use (vs not very and not at all comfortable) | 3.04 | (0.98–12.02) | 0.076 | |
| Had consulted remotely (vs had not) | 8.01 | (3.35–20.13) | <0.001 | |
| Difficulty in physical activity management (1 more difficult vs 0 neither more difficult nor easier, and easier) | Lived with other people (vs lived alone) | 1.93 | (0.93–4.22) | 0.087 |
| Received subsidies for health insurance (vs did not) | 1.88 | (0.93–3.81) | 0.078 | |
| More variability in blood glucose values (vs as usual or more stable) | 3.41 | (1.56–7.37) | 0.002 | |
| SF-12 PCS* (per one point score increase) | 0.63 | (0.46–0.86) | 0.004 | |
| Global stress due to COVID-19** (per one point increase) | 1.35 | (0.96–1.94) | 0.094 | |
| Received physical activity advice (vs did not) | 0.33 | (0.15–0.72) | 0.006 | |
| Received dietary advice (vs did not) | 2.50 | (1.16–5.49) | 0.021 | |
| Had consulted remotely (vs had not) | 3.29 | (1.56–6.89) | 0.002 | |
| Loneliness related to diabetes (1 sometimes and often lonely vs 0 never and rarely lonely) | Type 2 diabetes (vs type 1 diabetes and other) | 2.85 | (0.81–12.63) | 0.129 |
| SF-12 PCS* (per one point score increase) | 0.57 | (0.34–0.94) | 0.028 | |
| SF-12 MCS* (per one point score increase) | 0.35 | (0.20–0.59) | <0.001 | |
| ADDQoL score*** (per one point score increase) | 0.39 | (0.24–0.60) | <0.001 | |
| Somewhat to completely comfortable with IT use (vs not very and not at all comfortable) | 0.32 | (0.11–0.96) | 0.040 | |
ADDQoL: Audit of diabetes-dependent quality of life; CI: confidence interval; GAD-7: general anxiety disorder; IT: information technology; OR: Odds ratio; SF-12 MCS: Short-Form 12 mental component summary; SF-12 PCS: Short-Form 12 physical component summary.
* SF-12 PCS and MSC score: from 0 worst to 100 best
** Global stress due to COVID-19: from 0 not at all to 10 very stressed
*** ADDQoL score: from −9 most to +3 least impact of diabetes on quality of life
Table 5 presents multivariable analyses of the three continuous outcomes:
Concerns about the pandemic: depression, financial hardship, and variability in blood glucose values were all significantly associated with an increase in the level of concern, whereas better physical component summary scores were associated with lower levels of concern.
Impact of the pandemic:As with concerns, depression, financial hardship, and variability in blood glucose values were associated with an increased reported impact of the pandemic on participants’ lives, while better physical component summary and ADDQoL scores were associated with a lower impact.
Loneliness: having depression, being physically active, and receiving home care services were all significantly associated with a greater feeling of loneliness. Conversely, factors associated with reduced feelings of loneliness included living with someone as well as better mental component summary, physical component summary, and ADDQoL scores.
No association was found between the six COVID-19-related outcomes and age, sex, or type of diabetes.
Table 5Factors associated with continuous COVID-19-associated outcomes (linear regression models; n = 325). In bracket, baseline or increment. the Beta-coefficients indicates how much the collapsed principal component analysis-component (outcome) changes for each unit change in the predictor variable, keeping other variables constant. Final regression models are presented without other adjustement for potential confounding variables.
| β coefficient | 95% CI | p value | ||
| Concerns about the pandemic (from 1 not concerned to 3 very concerned) | Had difficulty paying bills (vs had not) | 0.28 | (0.05–0.52) | 0.020 |
| Complications (per one more complication) | −0.10 | (−0.20–0.01) | 0.078 | |
| Depression (vs no) | 0.45 | (0.24–0.67) | <0.001 | |
| More variability in blood glucose values (vs as usual or more stable) | 0.34 | (0.06–0.62) | 0.020 | |
| Vaccinated against COVID-19 (vs not) | −0.28 | (−0.68–0.11) | 0.163 | |
| SF-12 PCS* (per one point score increase) | −0.12 | (−0.23–−0.01) | 0.031 | |
| ADDQoL score** (per one point score increase) | −0.09 | (−0.20–0.03) | 0.141 | |
| Somewhat to completely comfortable with IT use (vs not very and not at all comfortable) | 0.20 | (−0.04–0.43) | 0.098 | |
| Physically active or partly active (vs inactive) | 0.16 | (−0.06–0.39) | 0.153 | |
| Impact of the pandemic (from 1 not impacted to 3 much impacted) | Age (per one year increase) | −0.09 | (−0.19–0.01) | 0.084 |
| Lived with other people (vs lived alone) | −0.18 | (−0.39–0.02) | 0.078 | |
| Had difficulty paying bills (vs had not) | 0.26 | (0.03–0.49) | 0.030 | |
| Received subsidies for health insurance (vs did not) | −0.17 | (−0.37–0.04) | 0.122 | |
| Depression (vs no) | 0.52 | (0.32–0.73) | <0.001 | |
| More variability in blood glucose values (vs as usual or more stable) | 0.39 | (0.12–0.65) | 0.005 | |
| SF-12 PCS* (per one point score increase) | −0.13 | (−0.23–−0.03) | 0.015 | |
| ADDQoL score** (per one point score increase) | −0.12 | (−0.22–−0.01) | 0.026 | |
| Physically active or partly active (vs inactive) | 0.21 | (0.00–0.42) | 0.055 | |
| Loneliness (from 1 never felt lonely to 4 often felt lonely) | Male (vs female) | −0.15 | (−0.34–0.04) | 0.121 |
| Lived with other people (vs lived alone) | −0.34 | (−0.54–−0.13) | 0.001 | |
| Current smoker (vs never and ex-smoker) | 0.22 | (−0.01–0.46) | 0.065 | |
| Depression (vs no) | 0.49 | (0.23–0.76) | <0.001 | |
| Self-monitored blood glucose (vs did not) | −0.29 | (−0.60–0.02) | 0.064 | |
| More variability in blood glucose values (vs as usual or more stable) | 0.23 | (−0.03–0.49) | 0.090 | |
| SF-12 PCS* (per one point score increase) | −0.14 | (−0.24–−0.03) | 0.012 | |
| SF-12 MCS* (per one point score increase) | −0.17 | (−0.30–−0.04) | 0.009 | |
| ADDQoL score** (per one point score increase) | −0.16 | (−0.26–−0.06) | 0.002 | |
| Physically active or partly active (vs inactive) | 0.22 | (0.01–0.43) | 0.038 | |
| Used home care services temporarily or regularly (vs did not) | 0.33 | (0.00–0.66) | 0.048 | |
| Hospitalised at least once (vs never) | −0.20 | (−0.45–0.04) | 0.109 | |
ADDQoL: Audit of diabetes-dependent quality of life; CI: confidence interval; IT: information technology; SF-12 MCS: Short-Form 12 mental component summary; SF-12 PCS: Short-Form 12 physical component summary.
* SF-12 PCS and MSC score: from 0 worst to 100 best
** ADDQoL score: from −9 most to +3 least impact of diabetes on quality of life
Our results suggest that people living with diabetes included in the CoDiab-VD cohort were not strongly affected by the COVID-19 pandemic in terms of their health and care. Indeed, access to diabetes care remained almost unchanged, with few consultations postponed or cancelled, and no reported increase in difficulty accessing diabetes-related treatment or materials. Additionally, most participants did not experience any increased difficulty in managing their diabetes during the pandemic, except for being physically active, which was more difficult for 16% of them. Few respondents reported a change in blood glucose values, and very few patients experienced more frequent episodes of hypoglycaemia or hyperglycaemia or were hospitalised due to diabetes. The aspects that concerned the greatest proportion of respondents were risks to their health and restrictions on their social life. The aspects most impacted by the pandemic were social life, hobbies, and lifestyle. However, few people felt excluded or isolated during the pandemic period.
The positive results we observed in terms of diabetes care might be explained by the strong recommendations made to people with diabetes to be very careful about their health, being considered at higher risk of severe COVID-19 infection than the general population [31]. This may explain the high rate of vaccination against COVID-19 observed (93.8%) in our cohort. Adequate diabetes control was reported by the participants, with consultations mostly maintained, including in-person and remote contact with health professionals; this was not the case reported in other countries [10–12, 14, 17]. We observed that individuals with more diabetes complications or those declaring more symptoms of anxiety had a higher risk of cancelled or postponed consultations. Conversely, having a remote consultation was also associated with an increased chance of having an in-person consultation cancelled or postponed, suggesting the need for remote consultation in times of health crisis. Remote care seems to be an appropriate alternative for people who need to avoid the establishment of a vicious circle from the absence of medical follow-up, reduced access to care, and consequent worsening of metabolic and mental health, as has been described in other studies [2, 14, 16].
Other surveys carried out with people living with diabetes have reported poorer diabetes control, greater weight gain, and more negative psychological and social effects during the pandemic than before [2, 10–15, 17, 20]. The results in our cohort were slightly different; in particular, participants did not report more glucose variability, occurrence of hyper- and hypoglycaemia, or hospitalisation for diabetes. This may be a result of the participant-reported lack of changes in diabetes self-management, medication use, appropriate diet, and the continued ease of access to diabetes medication or materials during the pandemic. Nevertheless, unlike the other self-management dimensions, physical activity was more difficult for one in six participants, which could be explained by the closure or restricted access to sports facilities during this period in Switzerland, or by participants’ fear of coming into contact with other people and being infected with SARS-CoV-2. Even with a partial reduction in physical activity, participants did not report worsening diabetes control. However, 16.1% of the participants reported weight gain, in line with other studies [32, 33].
Better self-perceived physical health, as measured with the SF-12 physical component summary, was associated with less difficulty in managing physical activity, lower levels of concerns about and impact of the pandemic, decreased loneliness and less risk of feeling lonely with one’s diabetes. This finding suggests that feeling in good physical health positively affects not only diabetes management but also how individuals experienced the pandemic in general. The effect of COVID-19 on health-related quality of life has been previously described, with mostly negative impacts observed in people living with diabetes [34]. Here, we show that better physical health seems to enable people to better cope with the pandemic.
The present study has two main strengths. First, it used data from a cohort with a diverse range of respondents living with diabetes, giving good heterogeneity in the sample. While the cohort was drawn from community pharmacies and designed to be representative of individuals with diabetes in the canton of Vaud, Switzerland, it is essential to acknowledge potential limitations in the representativeness of the sample. The sampling strategy, primarily through community pharmacies, may have introduced biases; although efforts were made to include a broad spectrum of individuals, caution is warranted in generalising the findings to the entire diabetic population in the region. Second, the questionnaire assessed various aspects of the participants’ experience of the pandemic, such as the management of diabetes and psychosocial burden. While interpreting these results, the following limitations should be considered: first, respondents had to recall their experiences over a very long period to answer the questions. Thus, we must consider that the survey was conducted at a single specific time and only reflects the patient’s perception at that time. Second, the cohort consists of adults with diabetes from a specific Swiss region, which may limit the generalisability of the present results. Third, since individuals unable to read French were not eligible for inclusion in the cohort, the interpretation of the present results is limited for people with migrant backgrounds who have not mastered French. Fourth, participants who willingly engaged in the cohort may possess higher health literacy, leading to a potential underrepresentation of individuals with lower health literacy or facing more significant health challenges; this could influence the generalisability of the findings. Finally, our data are self-reported and may therefore be prone to recall and desirability bias. However, since the importance of patient-reported experience measures has become increasingly recognised, self-reported data remain appropriate to assess how people living with diabetes experienced the COVID-19 pandemic [35].
Diabetes management among CoDiab-VD participants was not highly affected by the COVID-19 pandemic. Our results show that diabetes-related complications, depression, glucose variability, and financial insecurity were factors associated with access to care, self-management, and psychosocial burden during this period.
Maintenance of contact with healthcare professionals, psychological support, and the availability of remote consultations should be emphasised in crisis situations.
CoDiab-VD metadata are available in a public, open-access repository, and data are available upon reasonable request through the repository (CoDiab-VD: Cohort of Patients with Diabetes in the Canton of Vaud [Switzerland]), https://doi.org/10.16909/dataset/18 [22].
The authors thank the respondents for their participation in the surveys and the people involved in the data collection.
CoDiab-VD was supported by the Health Department of the canton of Vaud.
All authors have completed and submitted the International Committee of Medical Journal Editors form for disclosure of potential conflicts of interest. No potential conflict of interest related to the content of this manuscript was disclosed.
1. Chew HS, Lopez V. Global Impact of COVID-19 on Weight and Weight-Related Behaviors in the Adult Population: A Scoping Review. Int J Environ Res Public Health. 2021 Feb;18(4):1876. doi: https://doi.org/10.3390/ijerph18041876
2. Ghosh A, Arora B, Gupta R, Anoop S, Misra A. Effects of nationwide lockdown during COVID-19 epidemic on lifestyle and other medical issues of patients with type 2 diabetes in north India. Diabetes Metab Syndr. 2020;14(5):917–20. doi: https://doi.org/10.1016/j.dsx.2020.05.044
3. Blustein DL, Duffy R, Ferreira JA, Cohen-Scali V, Cinamon RG, Allan BA. Unemployment in the time of COVID-19: A research agenda. J Vocat Behav. 2020 Jun;119:103436. doi: https://doi.org/10.1016/j.jvb.2020.103436
4. Prati G. Mental health and its psychosocial predictors during national quarantine in Italy against the coronavirus disease 2019 (COVID-19). Anxiety Stress Coping. 2021 Mar;34(2):145–56. doi: https://doi.org/10.1080/10615806.2020.1861253
5. Serafini G, Parmigiani B, Amerio A, Aguglia A, Sher L, Amore M. The psychological impact of COVID-19 on the mental health in the general population. QJM. 2020 Jun;113(8):531–7. doi: https://doi.org/10.1093/qjmed/hcaa201
6. Karatas S, Yesim T, Beysel S. Impact of lockdown COVID-19 on metabolic control in type 2 diabetes mellitus and healthy people. Prim Care Diabetes. 2021 Jun;15(3):424–7. doi: https://doi.org/10.1016/j.pcd.2021.01.003
7. Zeigler Z. COVID-19 Self-quarantine and Weight Gain Risk Factors in Adults. Curr Obes Rep. 2021 Sep;10(3):423–33. doi: https://doi.org/10.1007/s13679-021-00449-7
8. Daniel MM, Liboredo JC, Anastácio LR, Souza TC, Oliveira LA, Della Lucia CM, et al. Incidence and Associated Factors of Weight Gain During the Covid-19 Pandemic. Front Nutr. 2022 Feb;9:818632. doi: https://doi.org/10.3389/fnut.2022.818632
9. Rudolph T, Eggenschwiler M, Kralle NC. Food Consumption 2021 - Ess- und Verzehrverhalten in Deutschland, Österreich und der Schweiz. St. Gallen, Switzerland: Forschungszentrum für Handelsmanagement; 2021.
10. Ratzki-Leewing AA, Ryan BL, Buchenberger JD, Dickens JW, Black JE, Harris SB. COVID-19 hinterland: surveilling the self-reported impacts of the pandemic on diabetes management in the USA (cross-sectional results of the iNPHORM study). BMJ Open. 2021 Sep;11(9):e049782. doi: https://doi.org/10.1136/bmjopen-2021-049782
11. Binhardi BA, de Souza Teixeira CR, de Almeida-Pititto B, Barbosa-Junior F, Franco LJ, de Melo KF, et al. Diabetes self-care practices and resilience in the Brazilian COVID-19 pandemic: results of a web survey: DIABETESvid. Diabetol Metab Syndr. 2021 Aug;13(1):87. doi: https://doi.org/10.1186/s13098-021-00706-8
12. Tejera-Perez C, Moreno-Pérez Ó, Rios J, Reyes-García R. People living with type 1 diabetes point of view in COVID-19 times (COVIDT1 study): disease impact, health system pitfalls and lessons for the future. Diabetes Res Clin Pract. 2021 Jan;171:108547. doi: https://doi.org/10.1016/j.diabres.2020.108547
13. Yeoh E, Tan SG, Lee YS, Tan HH, Low YY, Lim SC, et al. Impact of COVID-19 and partial lockdown on access to care, self-management and psychological well-being among people with diabetes: A cross-sectional study. Int J Clin Pract. 2021 Aug;75(8):e14319. doi: https://doi.org/10.1111/ijcp.14319
14. Shi Z, Yan A, Zimmet P, Sun X, Cristina do Vale Moreira N, Cheskin LJ, et al. COVID-19, Diabetes, and Associated Health Outcomes in China: Results from a Nationwide Survey of 10 545 Adults. Horm Metab Res. 2021 May;53(5):301–10. doi: https://doi.org/10.1055/a-1468-4535
15. Sacre JW, Holmes-Truscott E, Salim A, Anstey KJ, Drummond GR, Huxley RR, et al. Impact of the COVID-19 pandemic and lockdown restrictions on psychosocial and behavioural outcomes among Australian adults with type 2 diabetes: findings from the PREDICT cohort study. Diabet Med. 2021 Sep;38(9):e14611. doi: https://doi.org/10.1111/dme.14611
16. Ruissen MM, Regeer H, Landstra CP, Schroijen M, Jazet I, Nijhoff MF, et al. Increased stress, weight gain and less exercise in relation to glycemic control in people with type 1 and type 2 diabetes during the COVID-19 pandemic. BMJ Open Diabetes Res Care. 2021 Jan;9(1):e002035. doi: https://doi.org/10.1136/bmjdrc-2020-002035
17. Patel MR, Zhang G, Leung C, Song PX, Heisler M, Choe HM, et al. Impacts of the COVID-19 pandemic on unmet social needs, self-care, and outcomes among people with diabetes and poor glycemic control. Prim Care Diabetes. 2022 Feb;16(1):57–64. doi: https://doi.org/10.1016/j.pcd.2021.10.004
18. Di Gangi S, Lüthi B, Diaz Hernandez L, Zeller A, Zechmann S, Fischer R. Quality outcome of diabetes care during COVID-19 pandemic: a primary care cohort study. Acta Diabetol. 2022 Sep;59(9):1189–200. doi: https://doi.org/10.1007/s00592-022-01920-0
19. Zechmann S, Hotz L, Di Gangi S, Baumgartl K, Plate A, Potlukova E. Impact of SARS-CoV-2 Lockdown on Glycaemic Control: A Retrospective Observational Cohort Study in a Tertiary Setting. J Clin Med. 2021 Sep;10(18):4098. doi: https://doi.org/10.3390/jcm10184098
20. Grabia M, Markiewicz-Żukowska R, Puścion-Jakubik A, Bielecka J, Nowakowski P, Gromkowska-Kępka K, et al. The Nutritional and Health Effects of the COVID-19 Pandemic on Patients with Diabetes Mellitus. Nutrients. 2020 Sep;12(10):3013. doi: https://doi.org/10.3390/nu12103013
21. Maggio AB, Gal-Dudding C, Martin X, Chamay-Weber C. Evaluation of the impact of the COVID-19 lockdown on BMI in children and adolescents with or without obesity. BMC Pediatr. 2022 Aug;22(1):509. doi: https://doi.org/10.1186/s12887-022-03565-y
22. Peytremann-Bridevaux I, Zuercher E, Carron T. CoDiab-VD: Cohort of Patients with Diabetes in the Canton of Vaud (Switzerland). Version 1.0 ed. Lausanne, Switzerland: Center for Primary Care and Public Health (Unisanté), University of Lausanne; 2019. doi:
23. Antille-Zuercher E, Carron T, Peytremann-Bridevaux I. Cohorte CoDiab-VD : Caractéristiques des patient·e·s diabétiques vaudois·es et évaluation de leur prise en charge : Etat des lieux en 2017 et comparaison avec 2011-2012. Raisons de santé. Lausanne: Institut universitaire de médecine sociale et préventive (IUMSP); 2019. doi:
24. Zuercher E, Bordet J, Burnand B, Peytremann-Bridevaux I. CoDiab-VD: protocol of a prospective population-based cohort study on diabetes care in Switzerland. BMC Health Serv Res. 2015 Aug;15(1):329. doi: https://doi.org/10.1186/s12913-015-0991-0
25. Jolliffe IT, Cadima J. Principal component analysis: a review and recent developments. Philos Trans A Math Phys Eng Sci. 2016 Apr;374(2065):20150202. doi: https://doi.org/10.1098/rsta.2015.0202
26. Tavakol M, Dennick R. Making sense of Cronbach’s alpha. Int J Med Educ. 2011 Jun;2:53–5. doi: https://doi.org/10.5116/ijme.4dfb.8dfd
27. Pallant J. SPSS Survival Manual: A Step by Step Guide to Data Analysis Using IBM SPSS. 7th ed. London: McGraw-Hill Education; 2020.
28. Yamashita T, Yamashita K, Kamimura R. A Stepwise AIC Method for Variable Selection in Linear Regression. Commun Stat Theory Methods. 2007;36(13):2395–403. doi: https://doi.org/10.1080/03610920701215639
29. StataCorp. Stata Statistical Software: Release 17. College Station (TX): StataCorp LLC; 2021.
30. R Core Team. R: A language and environment for statistical computing. Vienna, Austria: R Foundation for Statistical Computing; 2021.
31. Zhou Y, Chi J, Lv W, Wang Y. Obesity and diabetes as high-risk factors for severe coronavirus disease 2019 (Covid-19). Diabetes Metab Res Rev. 2021 Feb;37(2):e3377. doi: https://doi.org/10.1002/dmrr.3377
32. Ghosh-Swaby OR, Goodman SG, Leiter LA, Cheng A, Connelly KA, Fitchett D, et al. Glucose-lowering drugs or strategies, atherosclerotic cardiovascular events, and heart failure in people with or at risk of type 2 diabetes: an updated systematic review and meta-analysis of randomised cardiovascular outcome trials. Lancet Diabetes Endocrinol. 2020 May;8(5):418–35. doi: https://doi.org/10.1016/S2213-8587(20)30038-3
33. Biamonte E, Pegoraro F, Carrone F, Facchi I, Favacchio G, Lania AG, et al. Weight change and glycemic control in type 2 diabetes patients during COVID-19 pandemic: the lockdown effect. Endocrine. 2021 Jun;72(3):604–10. doi: https://doi.org/10.1007/s12020-021-02739-5
34. Naous E, Boulos M, Sleilaty G, Achkar AA, Gannagé-Yared MH. Quality of life and other patient-reported outcomes in adult Lebanese patients with type 2 diabetes during COVID-19 pandemic. J Endocrinol Invest. 2022 Apr;45(4):763–72. doi: https://doi.org/10.1007/s40618-021-01701-6
35. Coulter A, Paparella G, McCulloch A. Listening to people: measuring views, experiences and perceptions. In: Anell A, Nolte E, Merkur S, editors. Achieving Person-Centred Health Systems: Evidence, Strategies and Challenges. European Observatory on Health Systems and Policies. Cambridge: Cambridge University Press; 2020. pp. 173–200. doi: https://doi.org/10.1017/9781108855464.010
36. Bodenmann P, Favrat B, Wolff H, Guessous I, Panese F, Herzig L, et al. Screening primary-care patients forgoing health care for economic reasons. PLoS One. 2014 Apr;9(4):e94006. doi: https://doi.org/10.1371/journal.pone.0094006
37. Ware J Jr, Kosinski M, Keller SD. A 12-Item Short-Form Health Survey: construction of scales and preliminary tests of reliability and validity. Med Care. 1996 Mar;34(3):220–33. doi: https://doi.org/10.1097/00005650-199603000-00003
38. Spitzer RL, Williams JB, Kroenke K, Linzer M, deGruy FV 3rd, Hahn SR, et al. Utility of a new procedure for diagnosing mental disorders in primary care. The PRIME-MD 1000 study. JAMA. 1994 Dec;272(22):1749–56. doi: https://doi.org/10.1001/jama.1994.03520220043029
39. Spitzer RL, Kroenke K, Williams JB, Löwe B. A brief measure for assessing generalized anxiety disorder: the GAD-7. Arch Intern Med. 2006 May;166(10):1092–7. doi: https://doi.org/10.1001/archinte.166.10.1092
40. Bush K, Kivlahan DR, McDonell MB, Fihn SD, Bradley KA. The AUDIT alcohol consumption questions (AUDIT-C): an effective brief screening test for problem drinking. Ambulatory Care Quality Improvement Project (ACQUIP). Alcohol Use Disorders Identification Test. Arch Intern Med. 1998 Sep;158(16):1789–95. doi: https://doi.org/10.1001/archinte.158.16.1789
41. Swiss Federal Statistical Office. Swiss Health Survey. Available from: https://www.bfs.admin.ch/bfs/fr/home/statistiques/sante/enquetes/sgb.html#1002476496
42. Bradley C, Todd C, Gorton T, Symonds E, Martin A, Plowright R. The development of an individualized questionnaire measure of perceived impact of diabetes on quality of life: the ADDQoL. Qual Life Res. 1999;8(1-2):79–91. doi: https://doi.org/10.1023/A:1026485130100
The appendix is available in the pdf version of the article at https://doi.org/10.57187/s.3578