Mortality atlas of the main causes of death for the elderly population (≥75 years)
in Switzerland during 2010–2020
DOI: https://doi.org/https://doi.org/10.57187/s.3433
Taru Singhalab,
Kaja Widmerab,
Anton Beloconiab,
Suzanne Dhainic,
Matthias Schwenkglenksd,
Cordula Blohme,
Rolf Weitkunate,
Sabina De Geestcf,
Penelope Vounatsouab
a Department of Epidemiology and Public Health, Swiss Tropical and Public Health Institute,
Basel, Switzerland
b University of Basel, Basel, Switzerland
c Department Public Health, Institute of Nursing Science, University of Basel, Basel,
Switzerland
d Department Public Health, Institute of Pharmaceutical Medicine (ECPM), University
of Basel, Basel, Switzerland
e Federal Statistical Office, Neuchâtel, Switzerland
f Academic Centre for Nursing and Midwifery, Department of Primary Care and Public Health,
KU Leuven, Belgium
Summary
BACKGROUND: Mortality atlases provide insight into the health burdens a
society is facing and help visualise them spatially. Here we estimate the geographical
distribution of different
mortality causes in the elderly population (≥75 years) in Switzerland. Knowledge of
the spatial patterns enables better identification of high-risk areas for specific
causes of death and potential risk factors, and can help guide policy, allocate resources
and raise awareness in a more targeted manner.
METHODS: We analysed Swiss mortality data, provided by the Swiss Federal
Statistical Office, for the elderly population (≥75 years) for the period 2010–2020.
We employed Bayesian spatial models for areal data to produce smoothed maps presenting
the age- and
sex-adjusted standardised mortality rates for the 25 main causes of death at
the municipality level. Additionally,
we evaluated the effects of language, urbanisation and income levels on
cause-specific mortality.
RESULTS: Language regions are associated
with mortality rates for many causes of death. In particular, the French-and Italian-speaking
regions are associated with a lower burden of mortality
due to cardiovascular diseases and diabetes compared to German-speaking
Switzerland, but this is offset by increased rates of certain cancers. In 2020, most
COVID-19 deaths were concentrated in the French- and
Italian-speaking regions. Higher
income levels tend to be a protective factor for most causes of death.
CONCLUSIONS: We have provided the first model-based mortality maps focusing on the
elderly population (≥75 years) in Switzerland. Our estimates identify areas with the
highest cause-specific mortality rates and indicate potential health services that
are needed in specific areas. The maps can also raise
awareness of the most prominent health problems of the ageing population in different
parts of the country and guide targeted health interventions.
Introduction
Switzerland is a culturally heterogeneous
country composed of 26 cantons, each with relative autonomy in legislating in healthcare-related
matters. This decentralised approach has led to differences in the design of health
policies regarding healthcare premium burden and tax systems, especially affecting
healthcare spending per wage bracket [1]. Although the impact of these discrepancies
on overall healthcare provisions may be relatively small, it is important to uncover
reasons for varying health outcomes in an ageing population [2]. The country’s unique
linguistic diversity, with a German-speaking population of 62%, a French-speaking
population of 23%, an Italian-speaking population of 8% and 0.5% speaking Romansh
presents further challenges for effective healthcare delivery such as communication
difficulties due to language barriers between health professional and patient,
cultural differences or stereotyping [3, 4]. Knowledge of the geographical distribution
of the cause-specific
mortality rates, particularly among the elderly population, can help physicians, nurses,
healthcare professionals and policymakers allocate resources and expertise more effectively.
A recurring analysis of spatial variations in health demands can also identify current
environmental, societal or cultural risk factors, which may provide a basis for locally
adapted
preventive measures. This study
presents a mortality atlas for Switzerland between 2010 and 2020, focusing on
geographical and chronological distribution of the causes of death for the
population aged 75 years or older. In
2019, the population aged 75 years or older accounted for 9% of the Swiss population
but contributed to 72% of deaths in Switzerland,
with cardiovascular disease and cancer being the leading causes. With increased healthy
ageing, the Swiss
population is living and working longer. In Switzerland, the 65–74 year age group
spends more on transport, leisure, food and health than any other age group.
However, from 75 years of age, there is a shift of spending
more on healthcare [5]. We investigated mortality in this more elderly population
aged 75 years or over as this is an often underrepresented age group that is particularly
vulnerable and requires extensive healthcare.
The Swiss healthcare system is globally recognised for its outstanding performance
in various areas, including mandatory health insurance coverage for the entire population
and subsidies for lower-income individuals. These factors have contributed to Switzerland’s
position as one of the European countries with the highest life expectancy [6, 7].
In terms of decision-making power, there
are several political actors involved, such as three levels of government
(federal, cantonal and municipal), recognised civil society organisations like
associations of health insurers and healthcare providers and the Swiss people themselves,
who can use public
referendums to veto or demand reform. The
Swiss federal government regulates vital aspects of healthcare, such as
financing through mandatory health insurance; pharmaceutical and medical device
safety; infectious disease control; food safety; health promotion; and research
and training [8, 9]. Meanwhile, the
provision of healthcare services is regulated at the cantonal level, although
hospitals from other cantons may also be included in their list of healthcare
providers. Cantons finance
approximately half of inpatient care. They are also responsible for issuing
and implementing a significant portion of health-related legislation and conducting
prevention and health promotion activities. To coordinate their efforts, particularly
for highly specialised medical care, the
cantons collaborate through the Conference of the Cantonal Ministers of Public
Health [10–12].
The investigation of the geographical
distribution of cause-specific mortality has become a classic approach in
epidemiological research. Various
studies that related mortality to environmental, socioeconomic, geographic or
resource-dependent factors have shown that causes of death and mortality rates
may vary by age, sex or region. In Europe, Italy, Spain and Germany have been most
active in performing geospatial analyses of mortality data. While
Spain mainly focused on the spectrum of different cancer types [13–16], Germany
has paid additional attention to diabetes-related deaths [17–19]. Instead of narrowing
it down to a specific
cause of death, in Italy, a municipality-specific atlas was produced, providing
information about the responsible factors behind all-cause mortality [20, 21]. Since
the 1990s, mortality studies have
become increasingly popular in Switzerland and have been conducted with a particular
focus on selected population groups, specific causes of death or with regard
to various explanatory variables. In
1997, the first descriptive mortality atlas in Switzerland was obtained by
visualising the geographical distribution of all-cause standardised mortality
rates (SMRs) [22]. Then the first mortality atlas for Switzerland was produced using
modelling techniques to smooth the standardised mortality rate estimates and explanatory
variables to assess potential reasons behind the spatial patterns observed [23]. The
maps were produced for numerous causes of death as well as for all-cause mortality.
Cause-specific mortality was analysed for coronary heart disease or stroke, and compared
between citizens from the highlands and lowlands [24], and the number of deaths
from lung cancer has also been analysed in smokers and nonsmokers [25]. Additionally,
mortality rates were compared between migrants and
native-born citizens [26] or between
citizens of the French or German language regions [27]. Education,traffic noise, air
pollution and altitude were
suggested as factors contributing to the observed disparities in mortality
rates [24, 28, 29]. Deaths related to myocardial infarctions and cancer were also
examined [29, 30]. The latter was also mapped, but only taking into account
mortality due to breast cancer among the female population [31, 32].
Our aim was to assess the regional and temporal patterns of mortality among the elderly
population aged 75 years or older
in Switzerland, and to contribute to the understanding of factors that
influence mortality. Consequently, we estimated the space-time distribution of cause-specific
mortality in Switzerland at the municipality level for the period
2010–2020, focusing on the elderly population (75 years of age or above). We analysed
mortality data from the Swiss Federal Statistical Office and, using Bayesian spatial
models, we estimated cause-specific standardised
mortality rates at the municipality level, adjusted for age and sex. Using data from
2020, we also aimed to examine the spatial patterns of COVID-19 mortality in Switzerland.
We further assessed changes in mortality
for different periods and investigated how various sociodemographic factors are
associated with the geographical distribution of the standardised mortality
rates.
Methods
We estimated municipality-level
cause-specific mortality for the elderly population (≥75 years) in Switzerland, focusing
on the main causes of death between 2010 and 2020. We standardised the mortality rates
for age and sex, and used Bayesian spatial
models with random effects for areal data to account for the spatial
correlation between municipalities and produce smoothed mortality maps. Bayesian spatial
models for areal data
filter variation due to noise and take into account potential spatial correlation
in mortality rates between municipalities by introducing spatially structured
random effects. The spatial correlation
is modelled via conditionally autoregressive (CAR) models [33, 34] and modifications
[35, 36] that are considered prior distributions for the random effects. The models
leverage spatial similarities and construct smoothed estimates based on
the spatial dependence structure [37]. Below,
we outline the data sources, describe the computation of standardised ratios
and present the methods used to produce the smoothed cause-specific mortality maps.
Mortality and population data
Mortality data for the 2010–2020 period were
provided by the Federal Statistical Office. The data included information on
the reported date of death, age, sex, the main and secondary causes of death,
the municipality – “Gemeinde” in German – of the patient’s residence and
of death. The data did not include
any personal identifiers; therefore, no additional data anonymisation or
ethical considerations were required for the analysis. The cause of death was reported
according to the International Classification
of Diseases, volume 10 (ICD-10, https://icd.who.int/browse10/2019/en). As we
analysed the cause-specific mortality, the deaths were classified into 39 causes as
proposed by the Centres for Disease Control and Prevention for tabulating mortality
data [38]. We further grouped the causes into 33
final groupings (summarised in table S1 in the appendix). We looked at major
causes, i.e. those accounting for the death of at least 300 people aged 75
years or older in Switzerland every year over the last five years (2015–2019); as
a result,
25 causes were used for modelling. We
produced mortality atlases for two periods, namely 2010–2014 and 2015–2019. We considered
two aggregated periods to overcome any small samples that may produce false patterns.
As 2020 was an atypical year due to COVID-19, we only used it to assess the COVID-19
mortality patterns and excluded it when looking at the other causes of death.
Annual population data disaggregated by sex,
age and municipality were extracted from the STAT-TAB interactive tables
provided by the Federal Statistical Office. Switzerland comprises 26 cantons,
which include a total of 143 districts(“Bezirke” in German).
These districts are further subdivided into the aforementioned municipalities, which
represent the lowest administrative
division. In 2021, Switzerland
comprised 2175 municipalities. The baseline maps with the municipality, district and
cantonal borders, as well as lakes, were created
using the 2021 swissBOUNDARIES3D product. The
data were downloaded from the Federal Office of Topography (Swisstopo). Municipalities
can undergo structural
changes over time, the most
common of which is the consolidation of several municipalities into one. These changes
occur on a yearly basis so to be able to compare different municipalities
through the years, we reshaped our population and mortality data to reflect the
boundaries for 2021.
Spatial analysis at a municipality level
Standardised mortality rates
To compare the mortality rates between different
municipalities, we used standardised mortality rates, adjusting for age and sex. Standardised
mortality rates allow us to
compare mortality rates of municipalities with the expected rates based on the
reference population’s (Switzerland’s) demographic norms, adjusting for
potential distribution differences. In
particular, we compared the observed mortality with the expected mortality, in each
age- and sex-specific
stratum, calculated on the basis of the national mortality rates [39, 40]. We standardised
using the indirect method as many strata in a municipality had too few observed deaths
to obtain robust mortality rate estimates [41, 42]. Furthermore, the indirect standardisation
approach is recommended when looking at within-country variation.
We adjusted for age and sex to account for potential differences in their distributions
across municipalities
[40]. Age was categorised and
adjusted in 5-year bands from 75 to 100, and then in a sixth category for all
those aged over 100. We used
nationwide mortality rates for the age- and sex-specific strata of interest over the
period of interest and applied them to the specific strata in the municipality
to obtain the expected number of deaths. We
then aggregated the expected and observed numbers over the different strata in
the municipality and compared the expected deaths with the observed ones.
An SMR value of 1 indicates that the risk of death is the same as the reference (national)
population; an SMR <1 means that the risk of death in the observed population is lower
than would be expected if its age and sex distribution were the same as the
reference population, while an SMR >1 means that the risk is greater for the population
observed [40]. A municipality’s SMR is considered statistically important if the 95%
Bayesian credible interval (BCI) does not include 1.
Spatial models
To obtain smoothed maps for cause-specific standardised mortality rates, we used a
Bayesian hierarchical model with spatial random effects. We assumed that the observed
number of deaths for a given cause in municipality i follows a negative binomial distribution with cause- and municipality-specific probability
of death:
Yi ~ NegBin (pi, r)
where
pi = r / (r + µi)
and relates to the mean number of deaths, µi and r, which captures the overdispersion. The model is formulated as follows:
log(µi) = log(Εi) + ΧT β + ωi
where µi is the mean number of deaths, Εi is the expected number of deaths, Χ is the matrix of observed covariates, β is the vector of the regression coefficients and ωi is the spatial random effect for municipality i.
To explain some of the spatial variation seen in the mortality distribution maps,
we modelled the cause-specific standardised mortality rates with the addition of covariates
(matrix Χ). We used urbanisation, primary language and net income per capita of each
municipality as provided by the Federal Statistical Office. These covariates are available
from 2018 and were reshaped to the boundaries of 2021. The reference categories were
set to the most frequent categories (rural for the Urbanisation covariate and German for the Language covariate). As Romansch-speaking areas make up fewer than 10% of
the municipalities, these regions were merged with German-speaking ones [23]. The
resulting coefficients (βs) are extracted in the form of a mortality risk ratio (MRR). An MRR expresses the
mortality rate of people in a specific category compared with the mortality rate of
people in the reference category. For example, an MRR of 1.2 for French-speaking Switzerland
would mean that the mortality rate is 20% greater in the French-speaking regions than
in the German-speaking regions. A covariate is considered statistically important
if the 95% BCI for the MRR does not include 1.
To explore the nuances of the mortality data, we performed additional Bayesian spatial
analysis for secondary cause of death as well as municipality of death, instead of
residence. The analysis also included the addition of covariates to assess how the
effects of
covariates changes between the different data.
We modelled the municipality-specific random effects (ωi) using the modified Besag-York-Mollié (BYM) formulation, which includes a structured
spatial component and an unstructured one to account for the spatial correlation and
non-spatial heterogeneity. The modified BYM approach allows for intuitive interpretations
of the conditional mean and variance of the spatial random effects, unlike the original
BYM model [36]. While there are other approaches to modelling the spatial dependence
[34, 35, 43, 44], the modified BYM approach generally performs as good as or even
better than the commonly used approaches [36].
The BYM2 random effect is then constructed as
where φ is the mixing parameter, τ is the marginal precision parameter, 𝒗 is the unstructured component and 𝒖* the scaled, structured component.
The hyperparameters are represented as
and
and we used the penalised complexity priors with
and
respectively, as explained in Rieblar et al. (2016) [36]. All modelling was done in
R-INLA [45].
Results
Overall mortality and overview of cause-specific mortality
Between 2010 and 2020, there were 519,468
deaths among the elderly population aged 75 years or older in Switzerland. Approximately
45% of deaths occurred in a municipality
other than the municipality of residence; 0.4%
of deaths occurred outside Switzerland. The
average number of deaths in the elderly, stratified by cause, sex and time period,
are presented in table 1. Cardiovascular diseases, specifically heart diseases represent
the leading cause of death among the elderly, followed by
cancer, with lung cancer causing the most deaths in men and breast cancer in
women. Falls also result in a lot of
deaths among the elderly. Overall,
men tend to have greater mortality rates than women for most causes in all
three periods. Women have higher
mortality rates for cerebrovascular disease, hypertensive disease, dementia, senility,
falls, intestinal diseases, multiple sclerosis, breast cancer and gynaecological cancer.
From 2010 to 2019, women also had a higher mortality rate from intestinal infections
than men. The
year 2020 had the highest mean number of deaths in the elderly per 100,000
people for both males and females. Many
causes had lower mean deaths in 2020 compared to the other periods. Exceptions are
that for women, deaths from
lung cancer are increasing consistently across the periods. COVID-19 also emerged
as a new cause of
death in 2020.
Table 1Mean
number of deaths in the elderly (≥75 years) in Switzerland per 100,000 people,
stratified by cause, sex and time period.
| Causes of death |
2010–2014 |
2015–2019 |
2020 |
| Female |
Male |
Female |
Male |
Female |
Male |
| Cardiovascular diseases |
|
2656 |
2772 |
2369 |
2369 |
2155 |
2195 |
| Heart disease |
1927 |
2084 |
1719 |
1796 |
1507 |
1654 |
| Cerebrovascular disease |
488 |
450 |
423 |
375 |
401 |
349 |
| Hypertensive disease |
134 |
84 |
135 |
81 |
167 |
88 |
| Atherosclerosis |
107 |
153 |
91 |
118 |
80 |
104 |
| All cancers |
|
803 |
1554 |
812 |
1434 |
771 |
1327 |
| Brain cancer |
15 |
26 |
15 |
29 |
18 |
27 |
| Breast cancer |
161 |
1 |
163 |
2 |
147 |
2 |
| Colorectal cancer |
122 |
197 |
111 |
171 |
99 |
157 |
| Gynaecological cancers |
87 |
NA |
81 |
NA |
74 |
NA |
| Liver cancer |
28 |
70 |
28 |
77 |
26 |
69 |
| Lung cancer |
108 |
315 |
125 |
276 |
136 |
246 |
| Melanoma and skin cancer |
26 |
51 |
26 |
50 |
23 |
55 |
| Oesophageal, stomach cancer |
42 |
109 |
40 |
96 |
42 |
85 |
| Pancreatic cancer |
87 |
92 |
96 |
102 |
90 |
96 |
| Prostate cancer |
0 |
411 |
0 |
357 |
NA |
321 |
| Urinary tract cancer |
52 |
155 |
51 |
151 |
45 |
148 |
| Non-Hodgkin’s lymphoma |
38 |
59 |
39 |
59 |
39 |
61 |
| Leukaemia |
39 |
67 |
39 |
65 |
33 |
60 |
| External causes |
|
222 |
260 |
216 |
251 |
211 |
225 |
| Intentional self-harm |
10 |
52 |
10 |
49 |
12 |
43 |
| Fall |
212 |
208 |
207 |
202 |
199 |
182 |
| COVID-19 |
NA |
NA |
NA |
NA |
867 |
1206 |
| Chronic respiratory disease |
160 |
313 |
165 |
260 |
127 |
192 |
| Dementia |
933 |
642 |
976 |
628 |
918 |
609 |
| Diabetes |
144 |
156 |
124 |
145 |
90 |
115 |
| Influenza and pneumonia |
172 |
213 |
203 |
248 |
145 |
186 |
| Intestinal infections |
18 |
15 |
23 |
16 |
16 |
18 |
| Intestinal diseases |
113 |
87 |
97 |
74 |
85 |
62 |
| Liver diseases |
17 |
39 |
17 |
33 |
15 |
32 |
| Multiple sclerosis |
7 |
4 |
8 |
5 |
6 |
5 |
| Parkinson’s |
69 |
135 |
66 |
136 |
63 |
111 |
| Renal failure |
63 |
84 |
76 |
89 |
88 |
101 |
| Senility |
84 |
44 |
85 |
49 |
71 |
43 |
| Sepsis |
18 |
22 |
19 |
22 |
18 |
26 |
| Spinal muscular atrophy |
10 |
14 |
10 |
15 |
10 |
12 |
| All other causes |
966 |
1105 |
1040 |
1163 |
1096 |
1232 |
| All causes |
6454 |
7451 |
6297 |
6929 |
6753 |
7698 |
Figure 1 depicts the spatial distribution of all-cause mortality for the period 2015–2019.
Mortality rates have been adjusted for age and sex. We
observe slightly increased mortality rates in eastern Valais, Bern, Glarus and parts
of Graubünden, St. Gallen, Uri, Schwyz, Solothurn and Aargau. 2010–2014 additionally
experienced a higher mortality rate in western Graubünden and central Switzerland
(figure S2 in the appendix). Both periods experienced slightly decreased mortality
rates in Geneva, southern Vaud and southern Ticino.
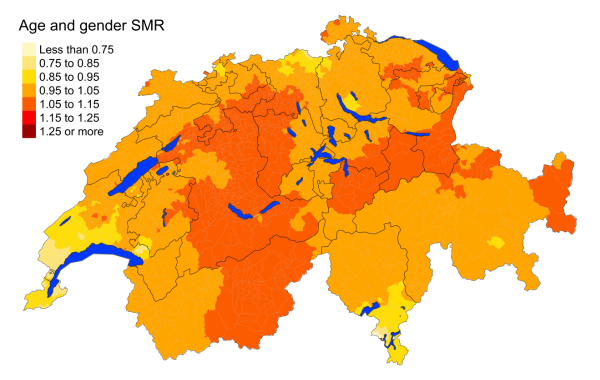
Figure 1Spatial distribution of all-cause mortality for the
elderly (≥75 years) in Switzerland for the period 2015–2019 adjusted for age and sex.
Estimates represent posterior means (PM) of
standardised mortality rate (SMR) obtained from a Bayesian conditionally autoregressive
(CAR) model without covariates. The black
borders delineate the different cantons.
Cardiovascular disease
Cardiovascular disease is the leading cause
of mortality, accounting for 36% of deaths among the elderly population (≥75 years)
of Switzerland in 2015–2019. Figure 2 shows that mortality for overall cardiovascular
diseases is lower in the French- and Italian-speaking regions. Heart diseases are
more concentrated
in the German-speaking regions of Switzerland, with the exception of Graubünden. Cerebrovascular
mortality is distributed more
evenly throughout the country. Mortality
from hypertensive diseases is higher in the
German-speaking regions, with the French- and Italian-speaking regions showing standardised
mortality rates less than 0.75. Atherosclerosis deaths are least prevalent in western
Switzerland. The findings are consistent with the maps produced for the period 2010–2014
(figure
S3 in the appendix).
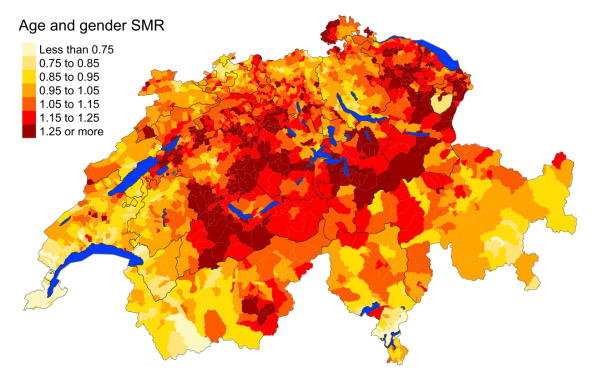
Figure 2aCardiovascular diseases: Spatial distribution
of cardiovascular disease mortality for the elderly (≥75 years) in Switzerland for
the period 2015–2019 adjusted for age and sex. Estimates represent posterior means
(PM)
of standardised mortality rate (SMR) obtained from a Bayesian conditionally autoregressive
(CAR) model without covariates. The black
borders delineate the different cantons.
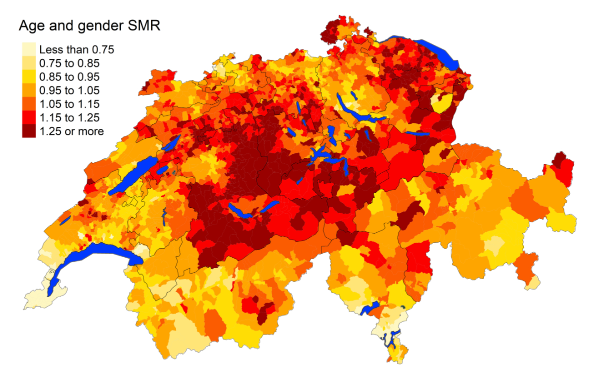
Figure 2bHeart diseases: Spatial distribution
of cardiovascular disease mortality for the elderly (≥75 years) in Switzerland for
the period 2015–2019 adjusted for age and sex. Estimates represent posterior means
(PM)
of standardised mortality rate (SMR) obtained from a Bayesian conditionally autoregressive
(CAR) model without covariates. The black
borders delineate the different cantons.
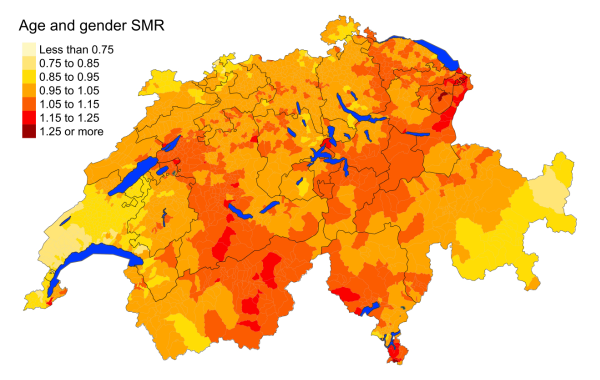
Figure 2cCerebrovascular diseases: Spatial distribution
of cardiovascular disease mortality for the elderly (≥75 years) in Switzerland for
the period 2015–2019 adjusted for age and sex. Estimates represent posterior means
(PM)
of standardised mortality rate (SMR) obtained from a Bayesian conditionally autoregressive
(CAR) model without covariates. The black
borders delineate the different cantons.
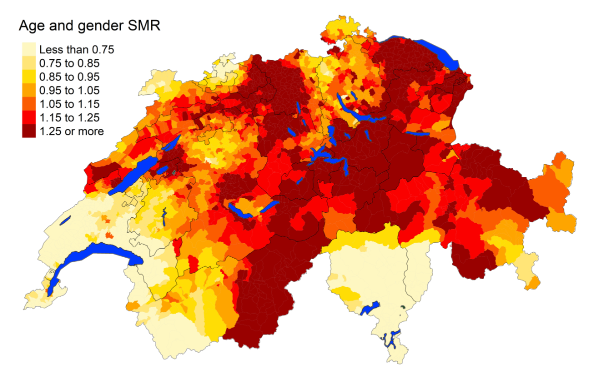
Figure 2dHypertensive diseases: Spatial distribution
of cardiovascular disease mortality for the elderly (≥75 years) in Switzerland for
the period 2015–2019 adjusted for age and sex. Estimates represent posterior means
(PM)
of standardised mortality rate (SMR) obtained from a Bayesian conditionally autoregressive
(CAR) model without covariates. The black
borders delineate the different cantons.
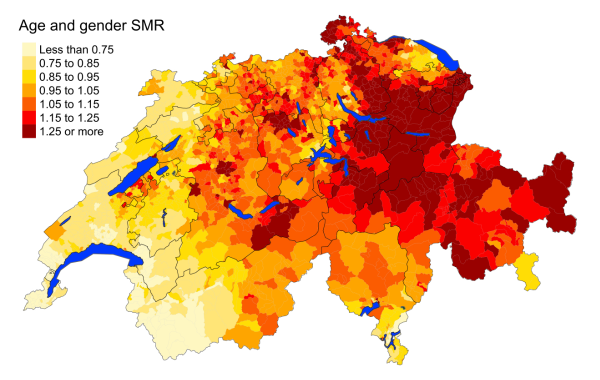
Figure 2eAtherosclerosis: Spatial distribution
of cardiovascular disease mortality for the elderly (≥75 years) in Switzerland for
the period 2015–2019 adjusted for age and sex. Estimates represent posterior means
(PM)
of standardised mortality rate (SMR) obtained from a Bayesian conditionally autoregressive
(CAR) model without covariates. The black
borders delineate the different cantons.
Overall, mortality rates of cardiovascular diseases (heart disease, cerebrovascular
disease, atherosclerosis and overall) are statistically lower in the French-speaking
regions compared with the German-speaking regions, with mortality risk ratio 0.84
(95% MRR BCI: 0.782, 0.908) (figure S1 in the appendix). Both the French- and Italian-speaking
regions have lower standardised mortality rates for hypertension compared to the German-speaking
regions, with an MRR of 0.719 (95% MRR BCI: 0.567, 0.912) and 0.348 (95% MRR BCI:
0.205, 0.600), respectively. Regions with higher net income are associated with lower
cardiovascular disease with mortality rate decreasing by 2.5% for every increase in
municipality-level annual income by CHF 10,000 (95% MRR BCI: 0.965, 0.986). This protective
effect of income is emphasised for heart disease. Rural areas compared to periurban
and urban areas have higher overall cardiovascular disease deaths, particularly for
heart disease. Urban areas have 9% lower mortality rates for overall cardiovascular
disease compared to rural areas (95% MRR BCI: 0.883, 0.939).
Cancers
Figure 3 suggests that, overall, cancers are similarly distributed throughout Switzerland,
with slightly higher overall standardised mortality rates in southern Ticino. However,
the mortality rates from specific cancers vary greatly from region to region. Lung
cancer seems to be more frequent in the Italian- and southern French-speaking regions,
with mortality rate ratios of 1.260 (95% MRR BCI: 1.087, 1.449) and 1.102 (95% MRR
BCI: 1.015, 1.207), respectively. Urinary tract cancer deaths are more prevalent in
southern Ticino. Gynaecological cancer deaths are more prevalent in Jura, Neuchâtel,
Vaud and eastern Graubünden. Deaths from prostate cancer appear to be more frequent
in central and northwestern Switzerland. Non-Hodgkin’s lymphoma deaths are higher
in Ticino, western Graubünden and Valais, but lower in the northwestern Swiss cantons
of Zurich, Schaffhausen, St Gallen and Appenzell. Liver cancer has the greatest contrast
in its standardised mortality rates: the French- and Italian-speaking municipalities
and surrounding regions face a much higher burden of deaths from liver cancer than
the German-speaking regions, with the Italian-speaking municipalities facing almost
twice the mortality rate (95% MRR BCI: 1.412, 2.610). Colorectal cancer deaths are
slightly more prevalent in Neuchâtel, but overall they are distributed evenly. Cancers
of the pancreas, breast, oesophagus and stomach, and leukaemia do not have notable
disparities in their spatial distributions.
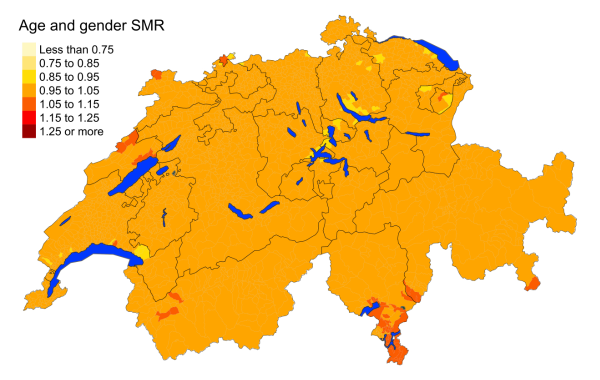
Figure 3aAll cancers: Spatial distribution of cancer mortality
for the elderly (≥75 years) in Switzerland for the period 2015–2019 adjusted for
age and sex. Estimates represent posterior means (PM) of standardised mortality
rate (SMR) obtained from a Bayesian conditionally autoregressive (CAR) model without
covariates. The black borders delineate the different cantons.
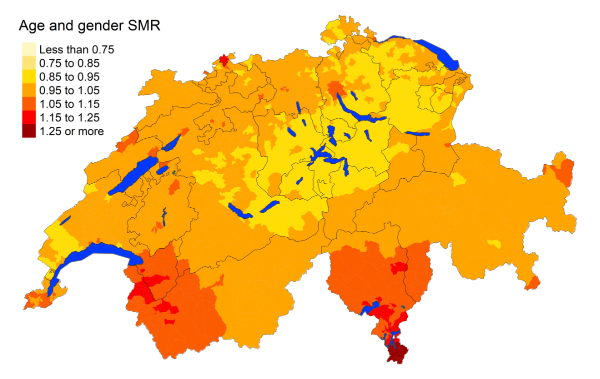
Figure 3bLung cancer: Spatial distribution of cancer mortality
for the elderly (≥75 years) in Switzerland for the period 2015–2019 adjusted for
age and sex. Estimates represent posterior means (PM) of standardised mortality
rate (SMR) obtained from a Bayesian conditionally autoregressive (CAR) model without
covariates. The black borders delineate the different cantons.
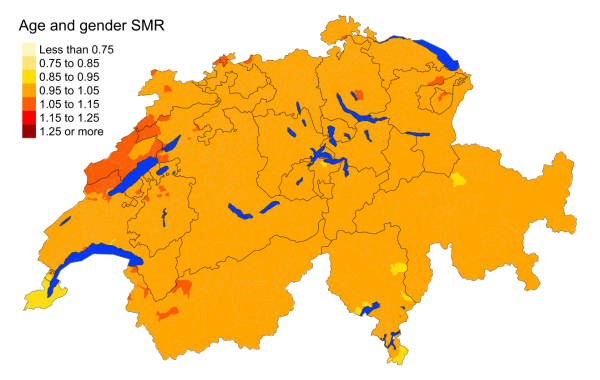
Figure 3cColorectal cancer: Spatial distribution of cancer mortality
for the elderly (≥75 years) in Switzerland for the period 2015–2019 adjusted for
age and sex. Estimates represent posterior means (PM) of standardised mortality
rate (SMR) obtained from a Bayesian conditionally autoregressive (CAR) model without
covariates. The black borders delineate the different cantons.
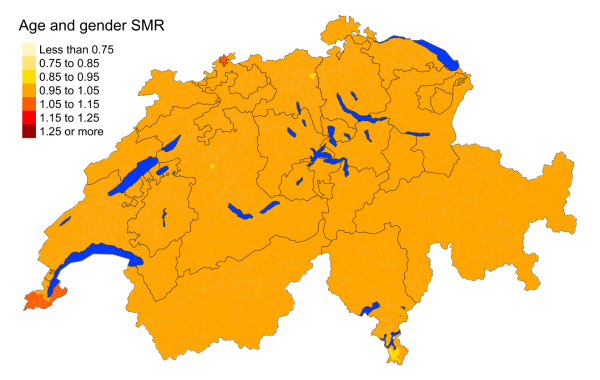
Figure 3dBreast cancer: Spatial distribution of cancer mortality
for the elderly (≥75 years) in Switzerland for the period 2015–2019 adjusted for
age and sex. Estimates represent posterior means (PM) of standardised mortality
rate (SMR) obtained from a Bayesian conditionally autoregressive (CAR) model without
covariates. The black borders delineate the different cantons.
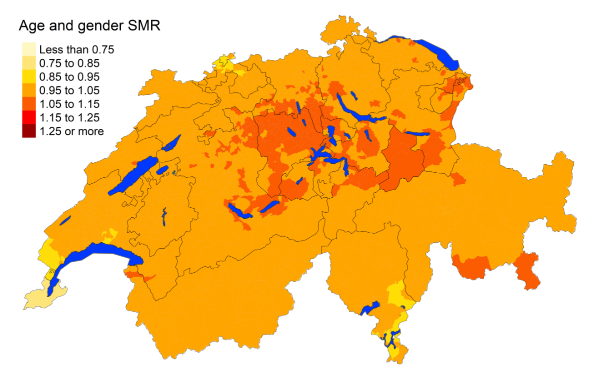
Figure 3eProstate cancer: Spatial distribution of cancer mortality
for the elderly (≥75 years) in Switzerland for the period 2015–2019 adjusted for
age and sex. Estimates represent posterior means (PM) of standardised mortality
rate (SMR) obtained from a Bayesian conditionally autoregressive (CAR) model without
covariates. The black borders delineate the different cantons.

Figure 3fPancreas cancer: Spatial distribution of cancer mortality
for the elderly (≥75 years) in Switzerland for the period 2015–2019 adjusted for
age and sex. Estimates represent posterior means (PM) of standardised mortality
rate (SMR) obtained from a Bayesian conditionally autoregressive (CAR) model without
covariates. The black borders delineate the different cantons.
Figure 3gUrinary tract cancer: Spatial distribution of cancer mortality
for the elderly (≥75 years) in Switzerland for the period 2015–2019 adjusted for
age and sex. Estimates represent posterior means (PM) of standardised mortality
rate (SMR) obtained from a Bayesian conditionally autoregressive (CAR) model without
covariates. The black borders delineate the different cantons.
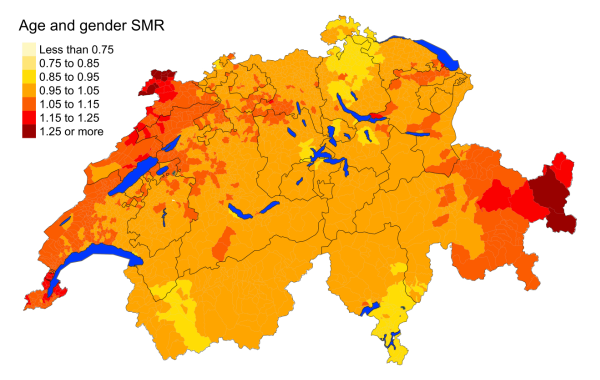
Figure 3hGynaecological cancer: Spatial distribution of cancer mortality
for the elderly (≥75 years) in Switzerland for the period 2015–2019 adjusted for
age and sex. Estimates represent posterior means (PM) of standardised mortality
rate (SMR) obtained from a Bayesian conditionally autoregressive (CAR) model without
covariates. The black borders delineate the different cantons.

Figure 3iLeukaemia: Spatial distribution of cancer mortality
for the elderly (≥75 years) in Switzerland for the period 2015–2019 adjusted for
age and sex. Estimates represent posterior means (PM) of standardised mortality
rate (SMR) obtained from a Bayesian conditionally autoregressive (CAR) model without
covariates. The black borders delineate the different cantons.
Figure 3jOesophagus and stomach cancer: Spatial distribution of cancer mortality
for the elderly (≥75 years) in Switzerland for the period 2015–2019 adjusted for
age and sex. Estimates represent posterior means (PM) of standardised mortality
rate (SMR) obtained from a Bayesian conditionally autoregressive (CAR) model without
covariates. The black borders delineate the different cantons.
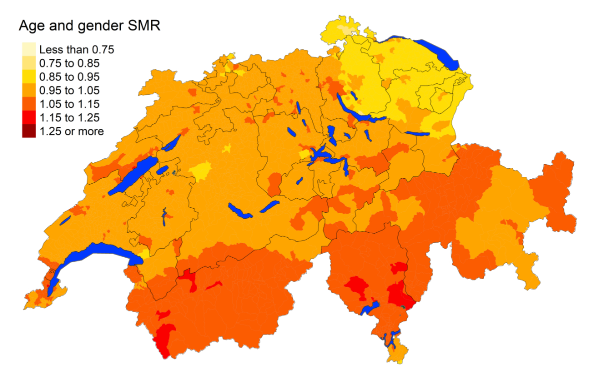
Figure 3kNon-Hodgkin’s lymphoma: Spatial distribution of cancer mortality
for the elderly (≥75 years) in Switzerland for the period 2015–2019 adjusted for
age and sex. Estimates represent posterior means (PM) of standardised mortality
rate (SMR) obtained from a Bayesian conditionally autoregressive (CAR) model without
covariates. The black borders delineate the different cantons.
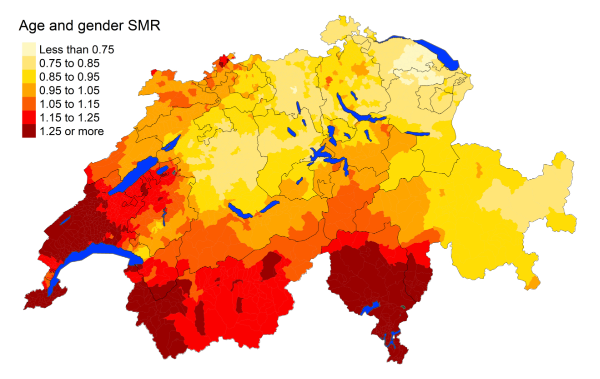
Figure 3lLiver cancer: Spatial distribution of cancer mortality
for the elderly (≥75 years) in Switzerland for the period 2015–2019 adjusted for
age and sex. Estimates represent posterior means (PM) of standardised mortality
rate (SMR) obtained from a Bayesian conditionally autoregressive (CAR) model without
covariates. The black borders delineate the different cantons.
For the period 2010–2014, there was a much higher
burden of deaths from oesophageal and stomach cancer in southern Switzerland,
with deaths being highly concentrated in the cantons of Ticino, Graubünden and Valais
(figure S4 in the appendix). Some other differences from the maps for 2010–2014
include decreasing spatial differences in the standardised
mortality rates for lung and prostate cancer, as well as leukaemia. On the other hand,
non-Hodgkin’s lymphoma and gynaecological
cancer deaths have increased in their spatial heterogeneity.
Cause-specific mortality rates were highly associated with language regions (figure
S1 in the appendix). French- and Italian-speaking regions have statistically higher
standardised mortality rates for deaths due to liver and lung cancer, with the Italian-
speaking regions experiencing almost twice the mortality rates of liver cancer (95%
MRR BCI: 1.412, 2.626) compared to the German-speaking regions. The Italian-speaking
regions face a greater burden of overall cancer mortality with a mortality risk ratio
of 1.098 (95% MRR BCI: 1.036, 1.163), also specific to urinary tract cancers. Additionally,
colorectal and pancreatic cancer mortality rates are higher in urban areas. Lung and
urinary tract deaths are more common in urban and periurban areas. With increasing
net income, we observed fewer deaths from overall cancer. Specifically, municipality-level
net income showed a protective factor for lung and stomach and oesophageal cancer,
with a decrease in mortality rates by approximately 5% for an increase in annual net
income in the municipality by CHF 10,000 (95% MRR BCI: 0.926, 0.970 and 95% MRR BCI:
0.920, 0.990, respectively).
Additional causes
There is a clear spatial disparity in deaths
from COVID-19 in the elderly aged 75 years or older (figure 4). Most deaths are concentrated
in the French- and Italian-speaking regions. Further looking into the secondary and
tertiary causes reported for
deaths from COVID-19, the most common comorbidities are diseases of the circulatory
and respiratory systems (figure S6 in the appendix). French- and Italian-speaking
regions have statistically higher standardised mortality rates for COVID-19 deaths
than the
German-speaking regions (figure S1 in the appendix). The
French-speaking regions face almost 6.5% greater mortality rates than the German-speaking
regions, while the Italian-speaking regions almost 7.8% greater mortality rates.
Maps of all additional main causes are shown
in figure 5. Chronic respiratory disease
deaths are more prevalent in southern Switzerland. Deaths from senility are generally
high, except in Vaud and Neuchâtel and parts of central Switzerland, Solothurn, Basel-Stadt,
Basel-Landschaft and Zurich. The German-speaking regions have a higher mortality from
diabetes compared to the French and Italian regions, with the exception of Zurich,
which also has lower deaths from diabetes. In contrast, the French- and Italian-speaking
regions have greater
deaths from influenza and pneumonia. Falls
are less prevalent in the French- and Italian-speaking regions. Intestinal disease
mortality is spread evenly
through the country. Parkinson’s disease deaths are slightly lower in Ticino, Vaud
and western Valais. Results are similar for maps constructed for 2010–2014,
with the exception of renal failure, where 2010–2014 deaths were concentrated in
southwestern Switzerland while 2015–2019 deaths were more prevalent in northwestern
Switzerland and parts of Graubünden
(figure S5 in the appendix).
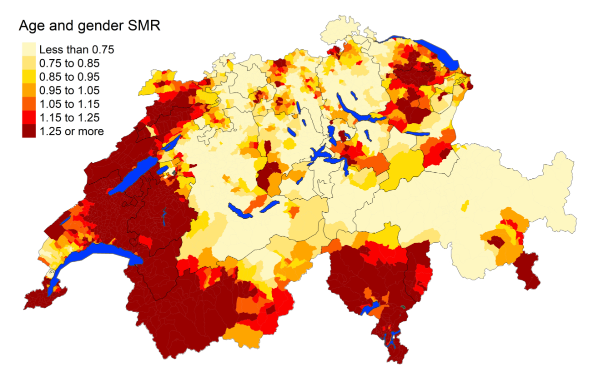
Figure 4Spatial distribution of COVID-19 mortality for the elderly (≥75 years) in Switzerland
for 2020 adjusted for age and sex. Estimates represent posterior means (PM) of standardised
mortality rate (SMR) obtained from a Bayesian
conditionally autoregressive (CAR) model without covariates. The black borders delineate
the different cantons.
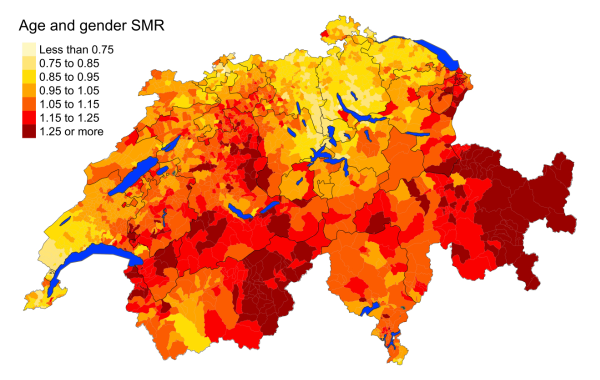
Figure 5aChronic respiratory disease: Spatial distribution of additional causes of mortality
for the elderly (≥75 years) in Switzerland for the period 2015–2019 adjusted for age
and sex. Estimates represent posterior means
(PM) of standardised mortality rate
(SMR) obtained from a Bayesian conditionally autoregressive (CAR) model without covariates.
The black borders delineate the different
cantons.
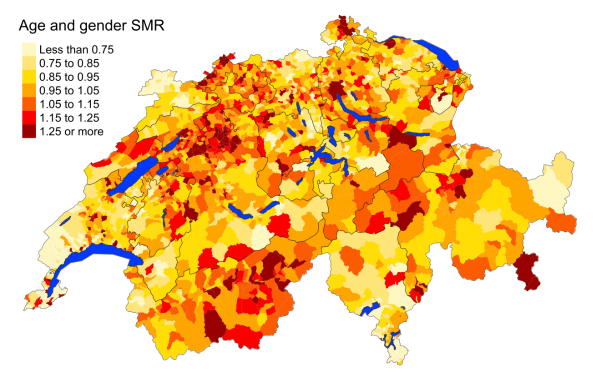
Figure 5bDementia: Spatial distribution of additional causes of mortality for the elderly (≥75
years) in Switzerland for the period 2015–2019 adjusted for age and sex. Estimates
represent posterior means
(PM) of standardised mortality rate
(SMR) obtained from a Bayesian conditionally autoregressive (CAR) model without covariates.
The black borders delineate the different
cantons.
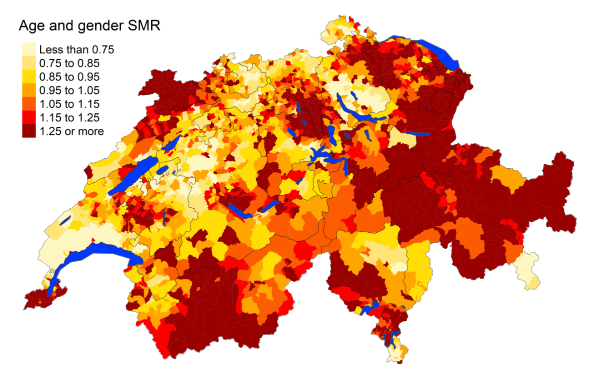
Figure 5cSenility: Spatial distribution of additional causes of mortality for the elderly (≥75
years) in Switzerland for the period 2015–2019 adjusted for age and sex. Estimates
represent posterior means
(PM) of standardised mortality rate
(SMR) obtained from a Bayesian conditionally autoregressive (CAR) model without covariates.
The black borders delineate the different
cantons.
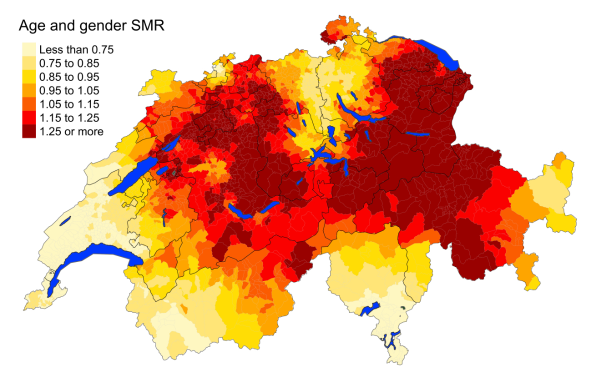
Figure 5dDiabetes: Spatial distribution of additional causes of mortality for the elderly (≥75
years) in Switzerland for the period 2015–2019 adjusted for age and sex. Estimates
represent posterior means
(PM) of standardised mortality rate
(SMR) obtained from a Bayesian conditionally autoregressive (CAR) model without covariates.
The black borders delineate the different
cantons.
Figure 5eInfluenza and pneumonia: Spatial distribution of additional causes of mortality for
the elderly (≥75 years) in Switzerland for the period 2015–2019 adjusted for age and
sex. Estimates represent posterior means
(PM) of standardised mortality rate
(SMR) obtained from a Bayesian conditionally autoregressive (CAR) model without covariates.
The black borders delineate the different
cantons.
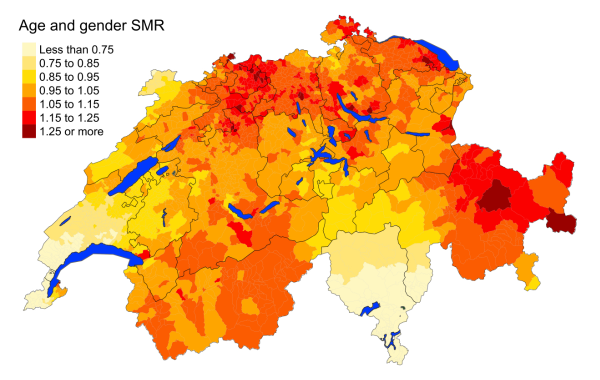
Figure 5fFalls: Spatial distribution of additional causes of mortality for the elderly (≥75
years) in Switzerland for the period 2015–2019 adjusted for age and sex. Estimates
represent posterior means
(PM) of standardised mortality rate
(SMR) obtained from a Bayesian conditionally autoregressive (CAR) model without covariates.
The black borders delineate the different
cantons.
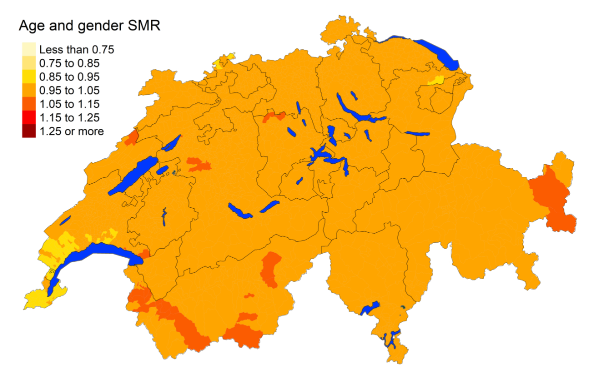
Figure 5gIntestinal disease: Spatial distribution of additional causes of mortality for the
elderly (≥75 years) in Switzerland for the period 2015–2019 adjusted for age and sex.
Estimates represent posterior means
(PM) of standardised mortality rate
(SMR) obtained from a Bayesian conditionally autoregressive (CAR) model without covariates.
The black borders delineate the different
cantons.
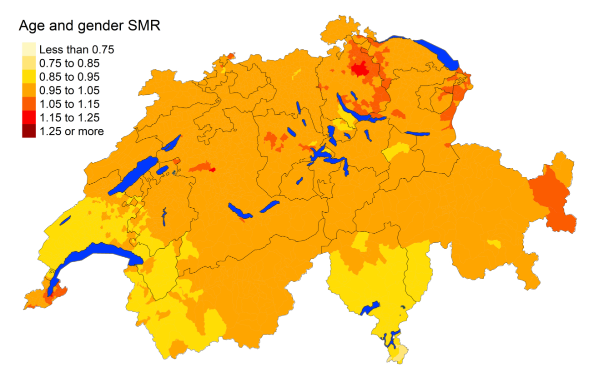
Figure 5hParkinson disease: Spatial distribution of additional causes of mortality for the
elderly (≥75 years) in Switzerland for the period 2015–2019 adjusted for age and sex.
Estimates represent posterior means
(PM) of standardised mortality rate
(SMR) obtained from a Bayesian conditionally autoregressive (CAR) model without covariates.
The black borders delineate the different
cantons.
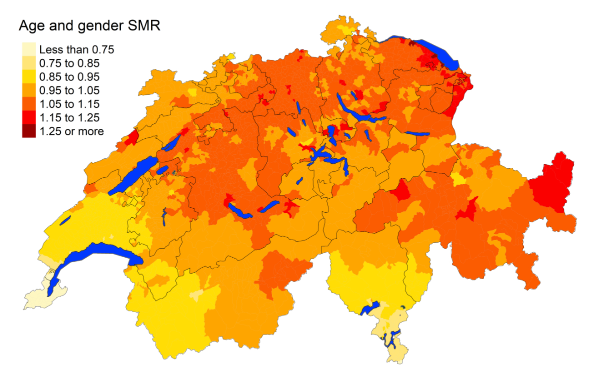
Figure 5iRenal failure: Spatial distribution of additional causes of mortality for the elderly
(≥75 years) in Switzerland for the period 2015–2019 adjusted for age and sex. Estimates
represent posterior means
(PM) of standardised mortality rate
(SMR) obtained from a Bayesian conditionally autoregressive (CAR) model without covariates.
The black borders delineate the different
cantons.
There is a negative association between mortality rates from diabetes, chronic respiratory
diseases, influenza and pneumonia and intestinal diseases with income (figure S1
in the appendix). In contrast, higher income areas do have greater deaths from Parkinson’s
disease. Mortality rates of dementia are 8% greater in urban areas compared to rural
areas (95% MRR BCI: 1.021, 1.14). On the other hand, the French- and Italian-speaking
regions have statistically lower standardised mortality rates compared to the German-speaking
regions for falls, diabetes and renal failure. The Italian-speaking communities face
almost 70% higher mortality rates from influenza and pneumonia (95% MRR BCI: 1.268,
2.247).
Statistically significant mortality maps
Figures S11 to S15 show municipalities with a statistically significant standardised
mortality rate. Statistically, a few municipalities in Ticino, Geneva and Vaud experienced
lower mortality rates for all-cause mortality compared with the national
mortality rates. The differences between regions for cerebrovascular mortality are
not statistically
significant. However, all other cardiovascular disease causes show statistically
lower mortality rates in the French- and Italian-speaking regions, while the German-speaking
regions have higher rates. For cancers, Ticino has multiple
municipalities with mortality rates statistically higher than the national average
for liver cancer. On the other hand, Geneva’s
municipalities have lower mortality rates for prostate cancer. Ticino has statistically
lower mortality rates
for diabetes and falls, but higher rates for influenza and pneumonia. The French-
and Italian-speaking regions have statistically higher mortality rates due to COVID-19,
while the German-speaking regions have lower rates.
Mortality based on secondary causes
We also produced maps based on secondary causes
and looked at the effects of covariates (figure S8 in the appendix). We highlighted
the spatial maps for mortality due to liver and lung
cancer (figure S7 in the appendix). While the spatial
distribution of mortality due to liver cancer as a secondary cause is similar to
that due to liver cancer as a primary cause, the distribution is complementary for
lung cancer.
All French-speaking regions have a lower mortality rate compared to German-speaking
regions for all secondary causes except liver cancer.
Mortality based on municipality of death
Finally, we produced maps based
on the municipality of death and looked at the effects of covariates (figure S10
in the appendix). We highlighted the spatial maps for mortality
due to cardiovascular disease and lung cancer (figure S9 in the appendix). The spatial
distribution for cause-specific
mortality when looking at municipality of death is heterogeneous, with a fraction
of municipalities accounting for a large number of deaths. There is an association
with
urbanisation for all causes, except for deaths occurring from senility and hypertensive
diseases.
Discussion
Our study offers a contemporary overview of
mortality patterns in Switzerland for the elderly population (aged 75 years or over)
between 2010 and 2020, and provides a comprehensive analysis of the spatial distribution
of potential risk factors. We used Bayesian
spatial models for areal data to generate smoothed maps of standardised mortality
rates at the municipality level for a wide range of mortality causes, including COVID-19
mortality in 2020. Switzerland is a culturally heterogeneous country with regional
variations in healthcare services due to various factors. Differences in demand-side
factors, such as demographic structure, patient attitudes and socioeconomic living
conditions, as well as
supply-driven variation such as medical guidelines, funding schemes and differences
in access to care, can contribute to regional variations in healthcare services
[46]. We assessed geographical disparities in standardised
mortality rates related to urbanisation, income and language regions. Our study underscores
the importance of considering
the spatial distribution of mortality and associated risk factors when developing
public health interventions and highlights the need for targeted interventions in
areas with high
cause-specific mortality rates.
The mortality rates of overall cardiovascular
diseases were statistically lower in the French-speaking regions of Switzerland
compared to the German-speaking regions, by 16% (95% MRR BCI: 0.775, 0.909). These
results were particularly pronounced
for hypertensive diseases and atherosclerosis and, to a lesser extent, heart diseases.
The Swiss Health Survey of 2017 found that residents of German-speaking Switzerland
are significantly more
likely to meet the physical activity recommendations (79%) than people living in
Italian-speaking (68%) and French-speaking (67%) parts of the country [47]. However,
the Swiss Health Observatory (Obsan) conducted a study on socioeconomic and cultural
inequalities
in the health behaviour of the Swiss population and found that the German-speaking
population recorded a higher proportion of obese individuals and a higher average
BMI compared to the French-speaking population [48]. These findings from Obsan align
with a comparison among EU member states,
which reported overweight rates of 46% among Italian adults and 47% among French
adults, while in Germany, the rate was considerably higher at 54% [49]. As obesity
was described as one of the main causes of high blood pressure, diabetes and subsequent
heart problems [50–52], this pattern is reflected in the geographic distribution
of mortality due to these diseases.
There is some evidence that moderate wine
consumption may be inversely associated with cardiovascular mortality [53–55]. As
wine consumption in the French-speaking regions is significantly higher compared
to the rest of Switzerland, it could further explain why mortality rates due to cardiovascular
diseases were lower in western Switzerland
[56]. Similar findings supporting the
positive effect of moderate wine consumption in terms of heart disease mortality have
been reported in France [57, 58]. Overall, France was identified as the European country
with the lowest mortality
rates for stroke and ischaemic heart disease [59], which is also reflected
in the geographical pattern of the Swiss heart mortality maps. Within Switzerland,
a study investigating the Mediterranean diet and mortality observed that alcohol consumption
was associated with a decrease in cardiovascular disease mortality [60]. Additionally,
a study investigating the differences
in mortality between the Swiss German- and French-speaking regions between 1990
and 2000 also observed similar results with reduced risk from cardiovascular disease
mortality, but increased risk from some cancers.
These studies looked at extended dietary factors such as vegetable intake, fat intake
and physical activity, among others. Even after accounting for these factors, there
is a protective effect of alcohol on coronary heart disease and stroke that is observed
in many French-speaking regions, though this effect may be influenced by a healthier
lifestyle [27].
Another factor that tends to play a beneficial
role in reducing the risk of cardiovascular disease is urbanisation, with urban areas
having
mortality rates almost 9% lower than rural areas (95% MRR BCI: 0.885,
0.946). Urban areas have been shown
to be linked to fewer deaths from heart diseases [61–63]. This finding may be due
to the generally higher
socioeconomic standards of people living in urban regions, such as Basel, Bern,
Zurich or Geneva, compared to the rural population of Switzerland. Families in lower
income categories were found to engage in less physical activity and have unhealthier
diets, which are important risk factors in the development of heart disease [48].
In addition, a Swiss study investigating driving times and cardiovascular mortality
found that for those above 65 years of age, increased driving times to the nearest
central and university hospitals were associated with increased acute myocardial infarction
and stroke mortality [64]. Urban areas tend to have better accessibility to hospitals
and medical facilities, with large agglomerations having the highest share of municipalities
with good accessibility. In contrast, smaller agglomerations and urban communities
outside agglomerations tend
to rank lowest in terms of accessibility [65].
Finally, a study investigating disease risk in relation to screening, prevalence and
management of high blood pressure throughout Switzerland provided additional possibilities
for the pronounced geographical differences
in hypertension mortality. Results showed
that cholesterol levels are screened much more frequently in the French- and Italian-speaking
parts of Switzerland than in the German-speaking regions [66]. The Swiss Health Care
Atlas further confirms
this increase in screening in the French- and Italian-speaking regions. The indicator
for low-density lipoprotein (LDL cholesterol) testing, a risk factor for cardiovascular
diseases, shows a greater standardised rate of testing in the French- and Italian-speaking
regions compared with the German-speaking regions, with Ticino and Geneva consistently
having the highest frequency of testing [67]. Therefore, a possible explanation
for these regional differences may be a higher level of education resulting in higher
disease awareness, but also a higher awareness of this risk factor among medical staff
in the French- and Italian-speaking regions.
The high screening rates in the French- and Italian-speaking regions suggest that
relatively simple medical measures can effectively manage hypertension, and hence
the geographical distribution of the cause of death from hypertension
in Switzerland may be attributed to these screening rates.
Certain types of cancer, such as lung cancer,
have been increasingly recorded as causes of death for women since 2010. Generally,
a relatively homogeneous distribution of deaths due to cancer was found across Switzerland.
However, an unusual geographical pattern was discovered in the case of liver cancer.
The Italian-speaking regions had almost twice
the death rates, and the French-speaking regions almost 40% greater death rates
from liver cancer than the German-speaking regions. The main risk factors for liver
cancer include alcoholism, often paired with a condition of liver cirrhosis, or tobacco
use
[68]. A possible explanation
for the observed geographical differences could be due to the lower consideration
of guidelines for safe alcohol consumption (which affects drinking habits) in the
French-speaking regions, potentially leading to higher likelihood of heavy drinking
[69]. Similar
findings of the association between alcohol levels, language regions and cancer mortality
were observed in two studies that examined data from a cross-sectional Swiss National
Nutrition
Survey, menuCH. These studies recorded extended data about dietary, sociodemographic
and lifestyle factors [69, 70]. Alcohol
was associated with increased liver cancer mortality, and French- and Italian-speaking
regions were associated with higher alcohol consumption. Another study investigating
the components of the Mediterranean diet and mortality in Switzerland also observed
the association between alcohol consumption and increased cancer mortality [60]. Furthermore,
a higher proportion of smokers
was reported in the western part of Switzerland [48]. Smoking patterns between neighbouring
countries are similar; France,
with 35.9% of the population smoking tobacco, ranks the highest, compared to Austria
with 28.3% of the population smoking cigarettes, Germany with only 25.8% smokers,
and closely followed by Italy with 24.6% [71].
Smoking patterns are also inherently linked to lung cancer rates. A higher mortality
rate due to lung cancer in western Switzerland has already
been observed; the same study also projected a decline in the mortality rates for
lung cancer from 2014 onward in the cantons of Vaud and Neuchâtel, which is consistent
with our findings of decreasing heterogeneity of lung cancer deaths in western Switzerland
from 2010–2014 to 2015–2019 (figures
3 and S4) [25]. A study based on mortality
data to 2008 found that Italianity is associated with lower prostate cancer mortality
in Switzerland [72]. This reduced mortality of
prostate cancer in the Italian-speaking part is consistent with the findings from
the period 2010–2014, but is no longer seen for the period 2015–2019 (figures 3
and S4). For oesophageal and stomach cancer
one would expect higher mortality in Italian-speaking Switzerland due to higher
prevalence of a resistant Helicobacter pylori strain [73]. While this is true for the period 2010–2014 (figure S4 in the appendix),
it is not the case for the
period 2015–2019, where the distribution seems consistent throughout Switzerland.
An observational study based on Swiss claims found that, overall,
French- and Italian-speaking regions had higher utilisation rates for screening
types [74]. The study also observed an increase in colonoscopy
frequency from 2014 to 2018. Screening colonoscopies are associated with decreased
colorectal cancer mortality risk [75].
Furthermore, the Swiss Health Care Atlas
indicates that Ticino is the canton with the highest frequency of colonoscopies
[67]. The overall increase
in colonoscopies over time, combined with the higher likelihood of receiving a colonoscopy
in the Italian-speaking region, could help explain the observed reduction in mortality
risk for oesophageal and stomach cancer in these regions in 2015–2019.
Our analysis showed a 6–7% lower mortality rate
due to COVID-19 in German-speaking Switzerland compared to French- and Italian-speaking
Switzerland. Interventions addressing
mobility for non-essential activities were significantly less restrictive in the
German-speaking cantons than in the French-speaking cantons. Less movement usually
translates to lower social
contact and therefore a smaller transmission risk and lower mortality. However, areas
with higher trust in public
institutions and officials were found to have a lower decrease in mobility [76]. This
suggests that the willingness to follow
public health guidelines, such as wearing masks and social distancing, was greater
in German-speaking Switzerland. This offers
a possible explanation for lower COVID-19 transmission rates and, ultimately, lower
mortality rates in these cantons.
Socioeconomic factors such as income, education
and place of residence are important health determinants and may further help to
explain geographical differences in cause of death. First, an inverse relationship
between social class and mortality has been well established,
meaning that higher income levels were consistently associated with a lower risk of
mortality [77]. A possible explanation
for this relationship may be that lower income levels are often linked to a poorer
diet, fewer social amenities and worse working conditions [77], which may contribute
to higher mortality rate of individuals in lower social classes. Even after accounting
for potential confounding
factors, inadequate income is still associated with a higher risk of mortality. In
the United States, lower socioeconomic
status was linked to a higher incidence of diseases such as heart disease, hypertension,
diabetes, respiratory infections and lung cancer [78]. Similarly, a study of 11 European
countries found that mortality inequalities persisted across different age groups,
with house owners and those with
higher levels of education facing lower mortality rates [79]. Overall, house owners
and those with higher education, as a proxy for socioeconomic status, faced lower
mortality rates [79].
Additionally, people with lower
socioeconomic status were found to be more likely to develop chronic diseases such
as diabetes, heart disease
and cancer [80]. Another plausible reason
for increased mortality and chronic conditions in those with lower incomes is use
of preventive medicine and access to healthcare. A study examining variation in the
use
of preventive care in 14 European countries found that those with higher incomes and
higher education use more preventive services including cancer screening and have
a higher probability of consulting a general
practitioner [81]. Our analysis aligns
with these findings and suggests that lower-income municipalities may be risk factors
for a range of mortality causes, including cardiovascular disease, cancers, diabetes,
chronic respiratory diseases, influenza and pneumonia and intestinal diseases. However,
we should be cautious when considering municipality per capita income, as our target
population is those individuals aged 75 years or more who no longer form part of the
working
population. Therefore, in this context,
net income serves as a proxy for municipalities with higher overall salary levels
rather than reflecting current earnings.
The cause of death is reported using the ICD-10, which is known to have variability
and some internal inconsistencies [82]. A study conducted
in three cities in France independently classified causes of death as per the national
mortality register. The study found significant differences in classification particularly
for deaths from cardiovascular disease and ill-defined causes. The proportion of disagreement
increased for individuals greater than 85 years of age [83].
A study reviewing the cancer mortality trends in Switzerland also observed an increasing
error when attributing cause of death among the elderly due to increased disease
possibilities and comorbidities, which are not usually classified as the main underlying
cause [84].
These inconsistencies, especially among the elderly population, raise awareness about
the inherent variability when assigning cause of death. Literature suggests
that conditions such as chronic obstructive pulmonary disease and suicides are clinically
underreported on death certificates [85, 86]. The potential for inconsistency in determining
cause of death was highlighted
when the analysis for secondary causes showed systematic language-level differences,with
the French-speaking regions having lower
mortality rates for 23 out of 24 causes compared to the German-speaking regions. Another
consideration is that we link cause of death to the municipality of last residence,
but we do not know the duration
of time spent, and related exposures to risk factors in the municipality. However,
performing the analysis spatially at the population level reduces potential biases
due to differences between municipality of exposure and municipality of residence.
Almost half of the deaths occurred in municipalities other than the municipality of
residence, with a very small number occurring abroad. Nevertheless,
we primarily looked at municipality of residence and not municipality of death as
the latter reflects the urbanisation status and related health service offerings
rather than exposure to specific risk factors. Further analysis could be conducted
to better understand the temporal trends and factors behind the difference in patterns
between
the municipality of residence and municipality of death. Additional aspects to consider
when extending the analysis include looking into other explanatory environmental and
geographical covariates when exploring the potential associations in the spatial
maps, such as access to healthcare. Possibilities
for future extensions include constructing spatiotemporal models that assume temporally
varying spatial patterns. Additionally, factors that differ at cantonal level could
be included in the model as covariates to quantify their effect and thus better understand
differences
in mortality at the cantonal level.
We present the first mortality atlas in Switzerland for the elderly population aged
75 years or older using the latest cause-specific mortality data and rigorous modelling.
Our estimates identify areas with the highest
cause-specific mortality rates and indicate potential health services that are needed
in specific areas. The maps therefore can raise awareness of the most prominent health
problems of the ageing population in different
parts of the country and can guide targeted health interventions.
Penelope Vounatsou
Department of Epidemiology and Public Health
Swiss Tropical and Public Health Institute
CH-4052 Basel
penelope.vounatsou[at]unibas.ch
References
1. Gerritzen BC, Kirchgässner G. Federalism in health and social care in Switzerland.
Federalism and decentralization in European health and social care. Springer; 2013.
pp. 250–71. doi: https://doi.org/10.1057/9781137291875_12
2. Crivelli L, Filippini M, Mosca I. Federalism and regional health care expenditures:
an empirical analysis for the Swiss cantons. Health Econ. 2006 May;15(5):535–41. doi: https://doi.org/10.1002/hec.1072
3. BFS. Sprachenlandschaft in der Schweiz. Neuchâtel: Bundesamt für Statistik (BFS);
2022. 23164427; Available from: https://dam-api.bfs.admin.ch/hub/api/dam/assets/23164427/master
4. Weber O, Semlali I, Gamondi C, Singy P. Cultural competency and sensitivity in the
curriculum for palliative care professionals: a survey in Switzerland. BMC Med Educ.
2021 Jun;21(1):318. doi: https://doi.org/10.1186/s12909-021-02745-1
5. OECD. Oecd economic surveys: Switzerland 2019. OECD; 2019. Available from: https://www.oecd-ilibrary.org/content/publication/7e6fd372-en
6. Camenzind P, Petrini L. Personen ab 55 Jahren im Gesundheitssystem: Schweiz und internationaler
Vergleich 2014. Obsan Dossier; 2014. p. 43.
7. Sturny I, Camenzind P, suisse de la santé O. Erwachsene Personen mit Erkrankungen-Erfahrungen
im Schweizer Gesundheitssystem im internationalen Vergleich: Auswertung des International
Health Policy Survey 2011 des Commonwealth Fund im Auftrag des Bundesamtes für Gesundheit
(BAG). Observatoire suisse de la santé; 2011.
8. Bilger M. Progressivity, horizontal inequality and reranking caused by health system
financing: a decomposition analysis for Switzerland. J Health Econ. 2008 Dec;27(6):1582–93.
doi: https://doi.org/10.1016/j.jhealeco.2008.07.009
9. De Pietro C, Camenzind P, Sturny I, Crivelli L, Edwards-Garavoglia S, Spranger A,
et al. Switzerland: health system review. Health Syst Transit. 2015;17(4):1–288.
10. Oggier W. Gesundheitswesen Schweiz 2015-2017: eine aktuelle Übersicht. Hogrefe AG;
2015.
11. Bieri O, Köchli H. Regionale Unterschiede bei der Belastung durch die obligatorischen
Gesundheitsausgaben: OKP-Prämien, Prämienverbilligungen und Steueranteile für das
Gesundheitswesen im kantonalen und kommunalen Vergleich. Schweizerisches Gesundheitsobservatorium.
Obsan; 2013.
12. Camenzind PA. Explaining regional variations in health care utilization between Swiss
cantons using panel econometric models. BMC Health Serv Res. 2012 Mar;12(1):62. doi: https://doi.org/10.1186/1472-6963-12-62
13. López-Abente G, Hernández-Barrera V, Pollán M, Aragonés N, Pérez-Gómez B. Municipal
pleural cancer mortality in Spain. Occup Environ Med. 2005 Mar;62(3):195–9. doi: https://doi.org/10.1136/oem.2004.015743
14. Lope V, Pollán M, Pérez-Gómez B, Aragonés N, Ramis R, Gómez-Barroso D, et al. Municipal
mortality due to thyroid cancer in Spain. BMC Public Health. 2006 Dec;6(1):302. doi: https://doi.org/10.1186/1471-2458-6-302
15. Pollán M, Ramis R, Aragonés N, Pérez-Gómez B, Gómez D, Lope V, et al. Municipal distribution
of breast cancer mortality among women in Spain. BMC Cancer. 2007 May;7(1):78. doi: https://doi.org/10.1186/1471-2407-7-78
16. Santos-Sánchez V, Córdoba-Doña JA, Viciana F, Escolar-Pujolar A, Pozzi L, Ramis R.
Geographical variations in cancer mortality and social inequalities in southern Spain
(Andalusia). 2002-2013. PLoS One. 2020 May;15(5):e0233397. doi: https://doi.org/10.1371/journal.pone.0233397
17. Becker N, Frentzel-Beyme R, Wagner G. Krebsatlas der Bundesrepublik Deutschland/Atlas
of Cancer Mortality in the Federal Republic of Germany: Deutsches Krebsforschungszentrum.
Heidelberg: Springer-Verlag; 2013.
18. Jacobs E, Hoyer A, Brinks R, Kuss O, Rathmann W. Burden of mortality attributable
to diagnosed diabetes: a nationwide analysis based on claims data from 65 million
people in Germany. Diabetes Care. 2017 Dec;40(12):1703–9. doi: https://doi.org/10.2337/dc17-0954
19. Bauer A, Alsen-Hinrichs C, Wassermann O. A cancer mortality atlas on a small geographic
scale: procedure, validity and possibilities for its use. Gesundheitswesen (Bundesverband
der Ärzte des Öffentlichen Gesundheitsdienstes (Germany)). 1999;61(2):93–100.
20. Luppi G, Camnasio M, Benedetti G, Covezzi I, Cislaghi C. [The Italian mortality map
at the municipal level]. Epidemiol Prev. 1995 Jun;19(63):132–41.
21. Fusco M, Guida A, Bidoli E, Ciullo V, Vitale MF, Savoia F, et al. [Mortality Atlas
of the Campania Region. All-cause and cause-specific mortality at municipal level,
2006-2014]. Epidemiol Prev. 2020;44(1 Suppl 1):1–144.
22. Bopp M. Regionale Sterblichkeitsunterschiede in der Schweiz: ein nicht ganz einfach
zu bestimmender Indikator für regional ungleiche Lebenschancen. Geogr Helv. 1997;52(4):115–23.
doi: https://doi.org/10.5194/gh-52-115-1997
23. Chammartin F, Probst-Hensch N, Utzinger J, Vounatsou P. Mortality atlas of the main
causes of death in Switzerland, 2008-2012. Swiss Med Wkly. 2016 Feb;146:w14280. Available
from: http://edoc.unibas.ch/42133/ doi: https://doi.org/10.4414/smw.2016.14280
24. Faeh D, Gutzwiller F, Bopp M; Swiss National Cohort Study Group. Lower mortality from
coronary heart disease and stroke at higher altitudes in Switzerland. Circulation.
2009 Aug;120(6):495–501. doi: https://doi.org/10.1161/CIRCULATIONAHA.108.819250
25. Jürgens V, Ess S, Phuleria HC, Früh M, Schwenkglenks M, Frick H, et al. Bayesian spatio-temporal
modelling of tobacco-related cancer mortality in Switzerland. Geospat Health. 2013 May;7(2):219–36.
doi: https://doi.org/10.4081/gh.2013.82
26. Zufferey J, Oris M. Spatial differentials in mortality in Switzerland: How do contexts
explain the differences between natives and migrants? Espace Populations Sociétés.
Hors-série; 2021. pp. 1–22.
27. Faeh D, Minder C, Gutzwiller F, Bopp M; Swiss National Cohort Study Group. Culture,
risk factors and mortality: can Switzerland add missing pieces to the European puzzle? J
Epidemiol Community Health. 2009 Aug;63(8):639–45. doi: https://doi.org/10.1136/jech.2008.081042
28. Bopp M, Minder CE; Swiss National Cohort. Mortality by education in German speaking
Switzerland, 1990-1997: results from the Swiss National Cohort. Int J Epidemiol. 2003 Jun;32(3):346–54.
doi: https://doi.org/10.1093/ije/dyg072
29. Héritier H, Vienneau D, Foraster M, Eze IC, Schaffner E, de Hoogh K, et al. A systematic
analysis of mutual effects of transportation noise and air pollution exposure on myocardial
infarction mortality: a nationwide cohort study in Switzerland. Eur Heart J. 2019 Feb;40(7):598–603.
doi: https://doi.org/10.1093/eurheartj/ehy650
30. Schmidlin K, Spoerri A, Egger M, Zwahlen M, Stuck A, Clough-Gorr KM; Swiss National
Cohort (SNC). Cancer, a disease of aging (part 2) - risk factors for older adult cancer
mortality in Switzerland 1991-2008. Swiss Med Wkly. 2012 Aug;142:w13607. doi: https://doi.org/10.4414/smw.2012.13607
31. Herrmann C, Ess S, Thürlimann B, Probst-Hensch N, Vounatsou P. 40 years of progress
in female cancer death risk: a Bayesian spatio-temporal mapping analysis in Switzerland.
BMC Cancer. 2015 Oct;15(1):666. doi: https://doi.org/10.1186/s12885-015-1660-8
32. Herrmann C, Vounatsou P, Thürlimann B, Probst-Hensch N, Rothermundt C, Ess S. Impact
of mammography screening programmes on breast cancer mortality in Switzerland, a country
with different regional screening policies. BMJ Open. 2018 Mar;8(3):e017806. doi: https://doi.org/10.1136/bmjopen-2017-017806
33. Clayton D, Kaldor J. Empirical Bayes estimates of age-standardized relative risks
for use in disease mapping. Biometrics. 1987 Sep;43(3):671–81. doi: https://doi.org/10.2307/2532003
34. Bernardinelli L, Montomoli C. Empirical Bayes versus fully Bayesian analysis of geographical
variation in disease risk. Stat Med. 1992 Jun;11(8):983–1007. doi: https://doi.org/10.1002/sim.4780110802
35. Besag J, York J, Mollié A. Bayesian image restoration, with two applications in spatial
statistics. Ann Inst Stat Math. 1991;43:1–20. doi: https://doi.org/10.1007/BF00116466
36. Riebler A, Sørbye SH, Simpson D, Rue H. An intuitive Bayesian spatial model for disease
mapping that accounts for scaling. Stat Methods Med Res. 2016 Aug;25(4):1145–65. doi: https://doi.org/10.1177/0962280216660421
37. Schlüter BS, Masquelier B. Space-time smoothing of mortality estimates in children
aged 5-14 in Sub-Saharan Africa. PLoS One. 2021 Jan;16(1):e0245596. doi: https://doi.org/10.1371/journal.pone.0245596
38. CDC/NCHS. ICD-10 cause-of-death lists for tabulating mortality statistics (updated
march 2009 to include WHO updates to ICD-10 for data year 2009); 2009. Available from:
https://www.cdc.gov/nchs/data/dvs/part9instructionmanual2009.pdf
39. Oberaigner W, Vittadello F. Cancer mapping in alpine regions 2001-2005. Insbruck:
Cancer Registry of Tyrol. 2010.
40. PAHO. Standardization: a classic epidemiological method for the comparison of rates.
Epidemiol Bull. 2002 Sep;23(3):9–12. Available from: https://www.paho.org/english/sha/be_v23n3-standardization.htm
41. International Union for the Scientific Study of Population. Comparison of direct and
indirect standardisation; n.d. Online; accessed 10 April 2024; Available from: http://papp.iussp.org/sessions/papp101_s06/PAPP101_s06_090_010.html
42. Breslow NE, Day NE. Statistical methods in cancer research. Volume II—the design and
analysis of cohort studies. IARC Sci Publ. 1987;(82):1–406.
43. Leroux BG, Lei X, Breslow N. Estimation of disease rates in small areas: a new mixed
model for spatial dependence. Statistical models in epidemiology, the environment,
and clinical trials. Springer; 2000. pp. 179–91. doi: https://doi.org/10.1007/978-1-4612-1284-3_4
44. Dean CB, Ugarte MD, Militino AF. Detecting interaction between random region and fixed
age effects in disease mapping. Biometrics. 2001 Mar;57(1):197–202. doi: https://doi.org/10.1111/j.0006-341X.2001.00197.x
45. Rue H, Martino S, Chopin N. Approximate Bayesian inference for latent Gaussian models
by using integrated nested Laplace approximations. J R Stat Soc Series B Stat Methodol.
2009;71(2):319–92. doi: https://doi.org/10.1111/j.1467-9868.2008.00700.x
46. Jörg R, Widmer M, Meier CA. The Swiss Atlas of Health Care: monitoring variations
in care to improve health care delivery in Switzerland. Swiss Med Wkly. 2023 Sep;153(9):s3440–3440.
doi: https://doi.org/10.57187/s.3440
47. Schweizerische Gesundheitsbefragung 2017-Körperliche Aktivität und Gesundheit. Neuchâtel:
Bundesamt für Statistik (BFS); 2019. 9546738; Available from: https://dam-api.bfs.admin.ch/hub/api/dam/assets/9546738/master
48. Boes S, Kaufmann C, Marti J. Sozioökonomische und kulturelle Ungleichheiten im Gesundheitsverhalten
der Schweizer Bevölkerung (Obsan Dossier 51). Schweizerisches Gesundheitsobservatorium.
Obsan; 2016.
49. Union OE. Health at a glance: Europe 2022 state of health in the eu cycle. OECD; 2022.
50. Sowers JR. Obesity as a cardiovascular risk factor. Am J Med. 2003 Dec;115(8 Suppl
8A):37S–41S. doi: https://doi.org/10.1016/j.amjmed.2003.08.012
51. Rana JS, Nieuwdorp M, Jukema JW, Kastelein JJ. Cardiovascular metabolic syndrome -
an interplay of, obesity, inflammation, diabetes and coronary heart disease. Diabetes
Obes Metab. 2007 May;9(3):218–32. doi: https://doi.org/10.1111/j.1463-1326.2006.00594.x
52. Rychter AM, Ratajczak AE, Zawada A, Dobrowolska A, Krela-Kaźmierczak I. Non-systematic
review of diet and nutritional risk factors of cardiovascular disease in obesity.
Nutrients. 2020 Mar;12(3):814. doi: https://doi.org/10.3390/nu12030814
53. Chiva-Blanch G, Arranz S, Lamuela-Raventos RM, Estruch R. Effects of wine, alcohol
and polyphenols on cardiovascular disease risk factors: evidences from human studies.
Alcohol Alcohol. 2013;48(3):270–7. doi: https://doi.org/10.1093/alcalc/agt007
54. Lucerón-Lucas-Torres M, Saz-Lara A, Díez-Fernández A, Martínez-García I, Martínez-Vizcaíno V,
Cavero-Redondo I, et al. Association between wine consumption with cardiovascular
disease and cardiovascular mortality: A systematic review and meta-analysis. Nutrients.
2023 Jun;15(12):2785. doi: https://doi.org/10.3390/nu15122785
55. Perissinotto E, Buja A, Maggi S, Enzi G, Manzato E, Scafato E, et al.; ILSA Working
Group. Alcohol consumption and cardiovascular risk factors in older lifelong wine
drinkers: the Italian Longitudinal Study on Aging. Nutr Metab Cardiovasc Dis. 2010 Nov;20(9):647–55.
doi: https://doi.org/10.1016/j.numecd.2009.05.014
56. Vidavalur R, Otani H, Singal PK, Maulik N. Significance of wine and resveratrol in
cardiovascular disease: french paradox revisited. Exp Clin Cardiol. 2006;11(3):217–25.
57. Martin MA, Goya L, Ramos S. Protective effects of tea, red wine and cocoa in diabetes.
Evidences from human studies. Food Chem Toxicol. 2017 Nov;109(Pt 1):302–14. doi: https://doi.org/10.1016/j.fct.2017.09.015
58. Hansel B, Thomas F, Pannier B, Bean K, Kontush A, Chapman MJ, et al. Relationship
between alcohol intake, health and social status and cardiovascular risk factors in
the Urban Paris-Ile-de-France Cohort: is the cardioprotective action of alcohol a
myth? Eur J Clin Nutr. 2010 Jun;64(6):561–8. doi: https://doi.org/10.1038/ejcn.2010.61
59. Union OE. Health at a glance: Europe 2018 state of health in the eu cycle. OECD; 2018.
60. Vormund K, Braun J, Rohrmann S, Bopp M, Ballmer P, Faeh D. Mediterranean diet and
mortality in Switzerland: an alpine paradox? Eur J Nutr. 2015 Feb;54(1):139–48. doi: https://doi.org/10.1007/s00394-014-0695-y
61. Chan F, Adamo S, Coxson P, Goldman L, Gu D, Zhao D, et al. Projected impact of urbanization
on cardiovascular disease in China. Int J Public Health. 2012 Oct;57(5):849–54. doi: https://doi.org/10.1007/s00038-012-0400-y
62. Sliwa K, Acquah L, Gersh BJ, Mocumbi AO. Impact of socioeconomic status, ethnicity,
and urbanization on risk factor profiles of cardiovascular disease in Africa. Circulation.
2016 Mar;133(12):1199–208. doi: https://doi.org/10.1161/CIRCULATIONAHA.114.008730
63. Yusuf S, Reddy S, Ôunpuu S, Anand S. Global burden of cardiovascular diseases: part
I: general considerations, the epidemiologic transition, risk factors, and impact
of urbanization. Circulation. 2001 Nov;104(22):2746–53. doi: https://doi.org/10.1161/hc4601.099487
64. Berlin C, Panczak R, Hasler R, Zwahlen M; Swiss National Cohort Study Group. Do acute
myocardial infarction and stroke mortality vary by distance to hospitals in Switzerland?
Results from the Swiss National Cohort Study. BMJ Open. 2016 Nov;6(11):e013090. doi: https://doi.org/10.1136/bmjopen-2016-013090
65. Jörg R, Lenz N, Wetz S, et al. Ein Modell zur Analyse der Versorgungsdichte. Neuchâtel:
Schweizerisches Gesundheitsobservatorium (Obsan); 2019.
66. Marques-Vidal P, Paccaud F. Regional differences in self-reported screening, prevalence
and management of cardiovascular risk factors in Switzerland. BMC Public Health. 2012 Mar;12(1):246.
doi: https://doi.org/10.1186/1471-2458-12-246
67. Obsan. Swiss Health Care Atlas; n.d. Online; accessed 16 April 2024; Available from:
https://www.versorgungsatlas.ch/en
68. Cirillo P, Feller A, Hošek M, et al. Schweizerischer Krebsbericht 2021: Stand und
Entwicklungen. Bundesamt für Statistik. BFS; 2021.
69. Bae D, Wróbel A, Kaelin I, Pestoni G, Rohrmann S, Sych J. Investigation of alcohol-drinking
levels in the Swiss population: differences in diet and associations with sociodemographic,
lifestyle and anthropometric factors. Nutrients. 2022 Jun;14(12):2494. doi: https://doi.org/10.3390/nu14122494
70. Suter F, Pestoni G, Sych J, Rohrmann S, Braun J. Alcohol consumption: context and
association with mortality in Switzerland. Eur J Nutr. 2023 Apr;62(3):1331–44. doi: https://doi.org/10.1007/s00394-022-03073-w
71. Teshima A, Laverty AA, Filippidis FT. Burden of current and past smoking across 28
European countries in 2017: A cross-sectional analysis. Tob Induc Dis. 2022 Jun;20(June):56.
doi: https://doi.org/10.18332/tid/149477
72. Richard A, Faeh D, Rohrmann S, Braun J, Tarnutzer S, Bopp M. Italianity is associated
with lower risk of prostate cancer mortality in Switzerland. Cancer Causes Control.
2014 Nov;25(11):1523–9. doi: https://doi.org/10.1007/s10552-014-0456-5
73. Maggi-Solcà N, Valsangiacomo C, Piffaretti JC. Prevalence of Helicobacter pylori resistant
strains in the southern part of Switzerland. Clin Microbiol Infect. 2000 Jan;6(1):38–40.
doi: https://doi.org/10.1046/j.1469-0691.2000.00015.x
74. Bähler C, Brüngger B, Ulyte A, Schwenkglenks M, von Wyl V, Dressel H, et al. Temporal
trends and regional disparities in cancer screening utilization: an observational
Swiss claims-based study. BMC Public Health. 2021 Jan;21(1):23. doi: https://doi.org/10.1186/s12889-020-10079-8
75. Doubeni CA, Corley DA, Quinn VP, Jensen CD, Zauber AG, Goodman M, et al. Effectiveness
of screening colonoscopy in reducing the risk of death from right and left colon cancer:
a large community-based study. Gut. 2018 Feb;67(2):291–8. doi: https://doi.org/10.1136/gutjnl-2016-312712
76. Deopa N, Fortunato P. Coronagraben in Switzerland: culture and social distancing in
times of COVID-19. J Popul Econ. 2021;34(4):1355–83. doi: https://doi.org/10.1007/s00148-021-00865-y
77. Marmot MG, Kogevinas M, Elston MA. Social/economic status and disease. Annu Rev Public
Health. 1987;8(1):111–35. doi: https://doi.org/10.1146/annurev.pu.08.050187.000551
78. Kaplan GA, Haan MN, Syme SL, et al. Socioeconomic status and health. Closing the Gap:
The Burden of Unnecessary Illness. 1987;125-129.
79. Huisman M, Kunst AE, Andersen O, Bopp M, Borgan JK, Borrell C, et al. Socioeconomic
inequalities in mortality among elderly people in 11 European populations. J Epidemiol
Community Health. 2004 Jun;58(6):468–75. doi: https://doi.org/10.1136/jech.2003.010496
80. Korda RJ, Paige E, Yiengprugsawan V, Latz I, Friel S. Income-related inequalities
in chronic conditions, physical functioning and psychological distress among older
people in Australia: cross-sectional findings from the 45 and up study. BMC Public
Health. 2014 Jul;14(1):741. doi: https://doi.org/10.1186/1471-2458-14-741
81. Jusot F, Or Z, Sirven N. Variations in preventive care utilisation in Europe. Eur
J Ageing. 2011 Oct;9(1):15–25. doi: https://doi.org/10.1007/s10433-011-0201-9
82. Surján G. Questions on validity of International Classification of Diseases-coded
diagnoses. Int J Med Inform. 1999 May;54(2):77–95. doi: https://doi.org/10.1016/S1386-5056(98)00171-3
83. Alpérovitch A, Bertrand M, Jougla E, Vidal JS, Ducimetière P, Helmer C, et al. Do
we really know the cause of death of the very old? Comparison between official mortality
statistics and cohort study classification. Eur J Epidemiol. 2009;24(11):669–75. doi: https://doi.org/10.1007/s10654-009-9383-2
84. Lutz JM, Pury P, Fioretta G, Raymond L. The impact of coding process on observed cancer
mortality trends in Switzerland. Eur J Cancer Prev. 2004 Feb;13(1):77–81. doi: https://doi.org/10.1097/00008469-200402000-00012
85. Jensen HH, Godtfredsen NS, Lange P, Vestbo J. Potential misclassification of causes
of death from COPD. Eur Respir J. 2006 Oct;28(4):781–5. doi: https://doi.org/10.1183/09031936.06.00152205
86. Kapusta ND, Tran US, Rockett IR, De Leo D, Naylor CP, Niederkrotenthaler T, et al. Declining
autopsy rates and suicide misclassification: a cross-national analysis of 35 countries.
Arch Gen Psychiatry. 2011 Oct;68(10):1050–7. doi: https://doi.org/10.1001/archgenpsychiatry.2011.66
Appendix
The appendix is available for download as a separate PDF file at https://doi.org/10.57187/s.3433.