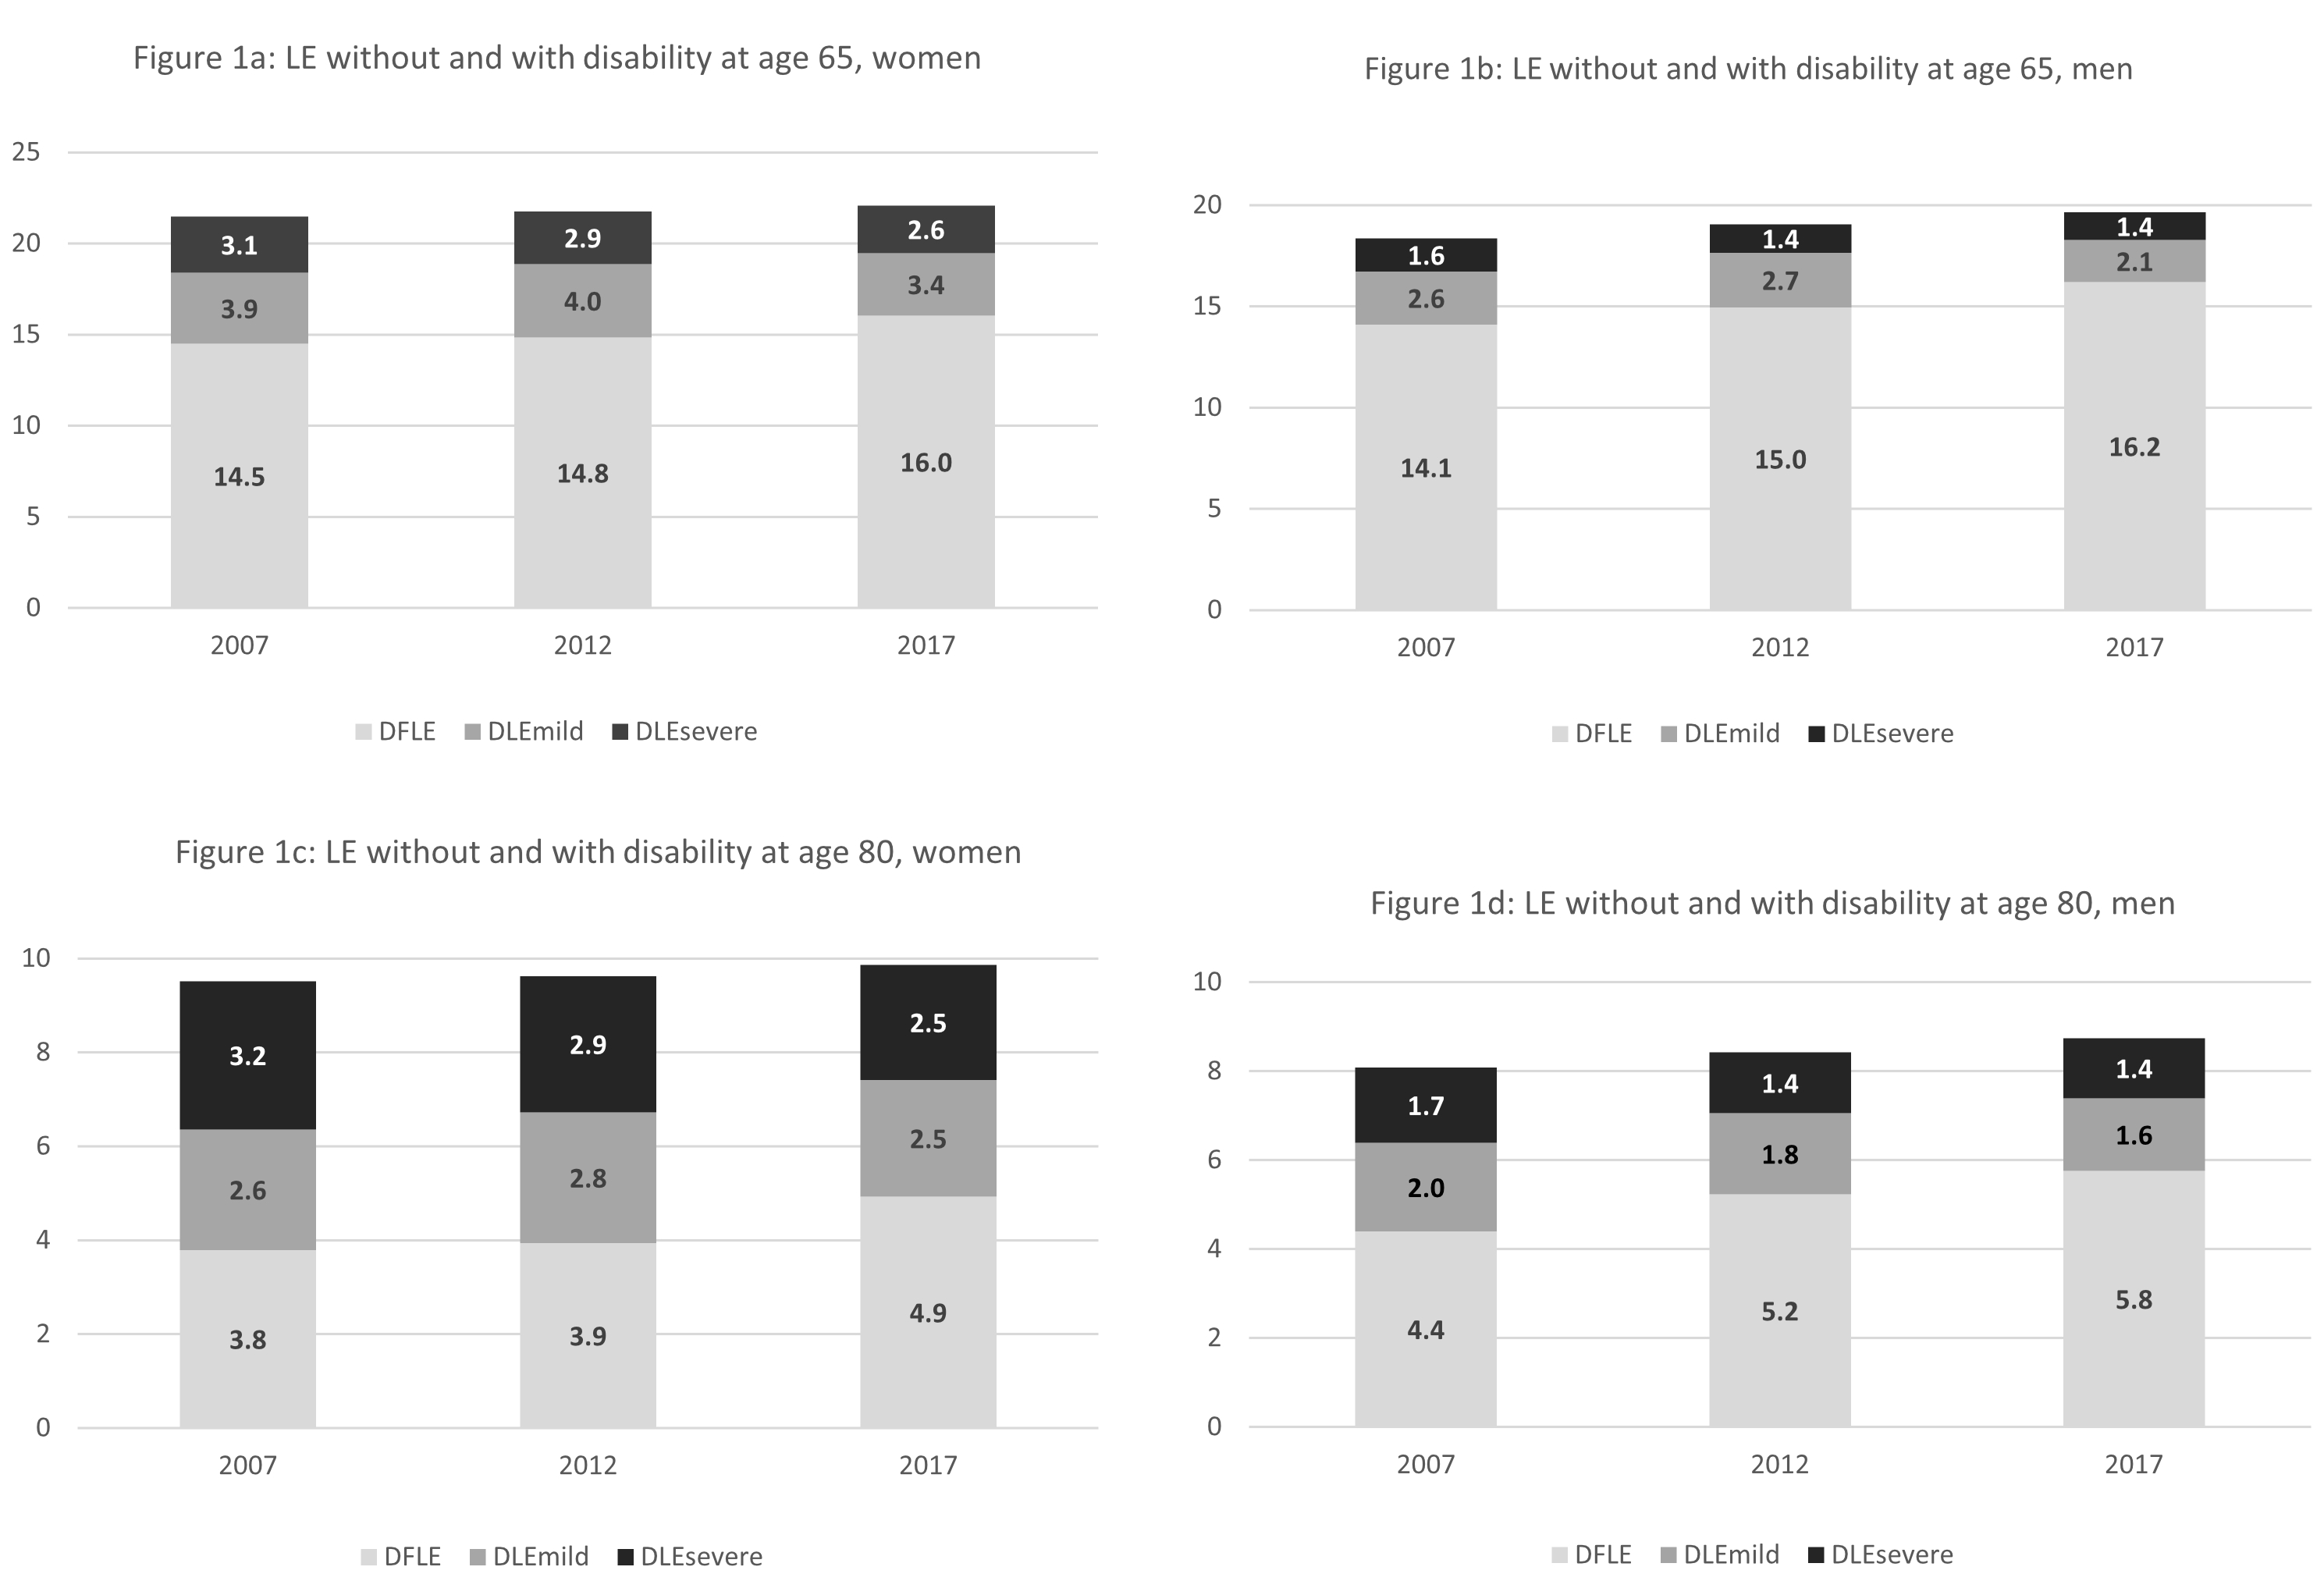
Figure 1 Trend in life expectancy without (DFLE), with mild (DLEmild), and with severe (DLEsevere) disability at 65 and 80 years of age, by sex. Mean values for DFLE and LEDmild and LEDsevere.
DOI: https://doi.org/10.57187/smw.2023.40043
Life expectancy has been increasing steadily throughout the past century in most industrialised countries, raising concerns about whether the years gained are spent in good health or with disability, such as the inability to perform the usual activities of daily living. Possible trends were conceptualised into the theories of an expansion or, inversely, a compression of the period of disability before death, or some dynamic equilibrium [1‒3]. Overall, studies conducted in the USA and in Europe before the year 2000 observed that the rise in life expectancy involved a shorter period of old age spent with disability, thus supporting the theory of compression of morbidity [4‒6]. However, later observations drew attention to reversing trends towards a prolonged period of old age with disability, in particular involving light-to-moderate disability [7‒9]. A recent systematic review indicated that gains in disability-free life expectancy did not match the growth in total life expectancy in several high-income countries [10]. Notably, the search for publications reporting on trends in life expectancy with and without disability after the year 2000 in Europe and North America retrieved only five studies. [7, 8, 11‒15]. Their results were heterogeneous, even though such divergence could be at least partly attributable to methodological differences. Whereas three studies reported a stable disability-free life expectancy [11‒13], the other two concluded that disability-free life expectancy increased [14, 15]. These studies also reported diverging trends in life expectancy with disability, recorded as stable or slightly declining in Northern Europe [11‒14], while slightly increasing in the US [15].
Disability-free life expectancy is an interesting summary indicator that allows the comparison of population health across countries and periods of time. At a national level, disability-free life expectancy is a useful indicator to elaborate policy responses to ageing of the population and to plan the provision of health and social care services. In the context of further gains in life expectancy at age 65 years in Switzerland, this work aimed to update the national estimates of disability-free life expectancy, as well as life expectancy with mild or severe disability over a 10-year period [6]. In addition, this study investigated the change in the proportion of disability-free life expectancy versus life expectancy during the same period. Our hypothesis was that disability-free life expectancy would remain stable or increase, while life expectancy with disability would remain stable or decrease.
Data on life expectancy were obtained from the national life tables produced by the Swiss Federal Statistical Office, by sex and 5-year age groups [16].
Other data were extracted from the Swiss Health Survey, which are available on request at the Federal Office for Statistics. This survey has been carried out every 5 years since 1992 on a representative sample of the Swiss adult population exclusive of persons living in collective households and persons whose asylum application is pending; the overall response rate was 51% in 2017[17]. Since 2007, each wave has included approximately 4500–5000 persons aged 65 years and over, of whom approximately 1000 are aged 80 years and over. The survey includes both a telephone-administered questionnaire and a complementary self-completed paper questionnaire. Participants who did not want or could not take part in the telephone questionnaire, for example because of hearing impairment, had the option of a face-to-face visit at their home. This option was also proposed to the participants aged 75 years and over.
Among other information, a telephone-administered questionnaire is used to collect data on self-reported disability in activities of daily living, allowing estimation of the national prevalence of disability by sex and age groups. At each survey, difficulty or inability to perform basic activities of daily living (dressing, bathing or showering, eating, getting in and out of bed, and using the toilet) and instrumental activities of daily living (cooking a meal, using the telephone, going out for shopping, doing the laundry, doing usual household chores, occasionally doing more involved household chores, managing money and using public transport) are assessed. The response options are similar for basic and instrumental activities of daily living, ranging from “no difficulty”, “some difficulty”, “much difficulty”, to “inability” to perform each activity without help. The latter two answers (“much difficulty” and “inability”) were used to define disability in the present work. Disability in one or more instrumental activities only was considered to be mild, while any disability in basic activities was considered to be severe regardless of the performance in instrumental activities of daily living. Examination of raw data indicated that only a very small proportion of persons reported a disability in basic ADLs without any disability in instrumental activities of daily living.
Data for 2007, 2012, and 2017 were used for the analyses, with sample weighting to take non-responses into account (FSO, 2018). In particular, the region of residence, gender, age, nationality, marital status and household size were taken into account for weighting. Trends in the prevalence of mild and severe disability have been published previously [18]. As non-response to these questions is low in the Swiss health survey (less than 3% in basic ADLs, and less than 1% in instrumental ADLs), participants with missing data were excluded in the analyses.
Disability-free life expectancy and life expectancy with disability at 65 and 80 years of age were estimated for each study wave using Sullivan’s method [19, 20]. This approach is widely used as it accounts for health as well as mortality, using prevalence data for health problems. An alternative approach, multistate methods, require incidence rates, less frequently available [21]. Person-years in 5-year age intervals obtained from life tables were multiplied by the age-specific prevalence of living without, with mild, and with severe disability. The expected lifetimes without any disability, with mild disability, and with severe disability were estimated by standard life table methods. Confidence intervals (CIs) for the estimates of disability-free life expectancy and life expectancy with disability were also computed. Persons with severe disabilities were assumed to also have mild disabilities, whereas the data on life expectancy with mild disability excluded persons with severe disabilities. Life expectancy with mild disability was, therefore, calculated as life expectancy minus disability-free life expectancy and life expectancy with severe disability. To account for people living in a nursing home and who were not surveyed, the prevalence of institutionalisation by sex and 5-year age groups [22] was included in the computation [20]. The prevalence is very low (<5%) in persons under the age of 80 years, and then increases sharply (7% at 80‒84 years, 17% at 85‒89 years and 37% at 90+ years old), with figures in women being about 1.5 times higher than in men[22], and it was assumed that all nursing home residents aged 65 years or over have both mild and severe disabilities.
Results for disability-free life expectancy and life expectancy with disability are presented as the mean estimate and the 95% CI. Statistical significance was defined as a p <0.05. Analyses were performed using R 4.0.4 [23].
According to Swiss Law, no approval from the ethics committee was needed for this project based on de-identified routine health data.
Participants gave informed consent when accepting to participate in the Swiss Health Survey.
Between 2007 and 2017, the life expectancy at age 65 increased by 0.6 years in women and by 1.3 years in men, amounting to 22.1 years and 19.7 years, respectively. At age 80, the life expectancy increased by 0.4 years in women and by 0.6 years in men over this 10-year period, amounting to 9.9 years and 8.7 years, respectively.
Disability-free life expectancy at age 65 significantly increased in both sexes. For example, in 2007, a woman aged 65 years could expect to live approximately another 14.5 years (95% CI 14.2‒14.8) without disability compared with 16.0 years (95% CI 15.7‒16.4) in 2017 (fig. 1a and supplementary table in the appendix), a statistically significant difference between 2007 and 2017. Over the same period, both life expectancy with mild disability and life expectancy with severe disability declined among women over the study period by 0.5 years (from 3.9 to 3.4 years and from 3.1 to 2.6 years, respectively). Disability-free life expectancy at age 65 also significantly increased in men over the study period, amounting to a gain of 2.1 years of life without disability, from 14.1 years (95% CI 13.8‒14.4) to 16.2 years (95% C: 15.9‒16.5) years (fig. 1b). Over the same period, life expectancy with mild and with severe disability decreased by 0.5 and 0.2 years, respectively. At 80 years, trends observed over the study period in disability-free life expectancy and life expectancy with disability showed analogous, although smaller, increases in both sexes (fig. 1c and d). Notably, the gain in disability-free life expectancy exceeded one year in both sexes, whereas life expectancy with combined mild and severe disability decreased by 0.8 and 0.7 years in women and men, respectively.
Figure 1 Trend in life expectancy without (DFLE), with mild (DLEmild), and with severe (DLEsevere) disability at 65 and 80 years of age, by sex. Mean values for DFLE and LEDmild and LEDsevere.
Despite the increase in life expectancy between 2007 and 2017, the combined result of the expansion of disability-free life expectancy and reduction in life expectancy with disability over the same period led to a significant increase in the proportion of disability-free life expectancy versus life expectancy in both sexes. At 65 years of age, this proportion increased from 67% (95% CI 66‒69) to 73% (95% CI 71‒74) in women, and from 77% (95% CI 75‒79) to 82% (95% CI 81‒84) in men (fig. 2a). At 80 years of age, the proportion of disability-free life expectancy versus life expectancy LE also significantly increased in both sexes, from 40% (95% CI 37‒43) to 50% (95% CI 47‒53) in women, and from 54% (95% CI 50‒59) to 66% (95% CI 62‒70) in men (fig. 2b).
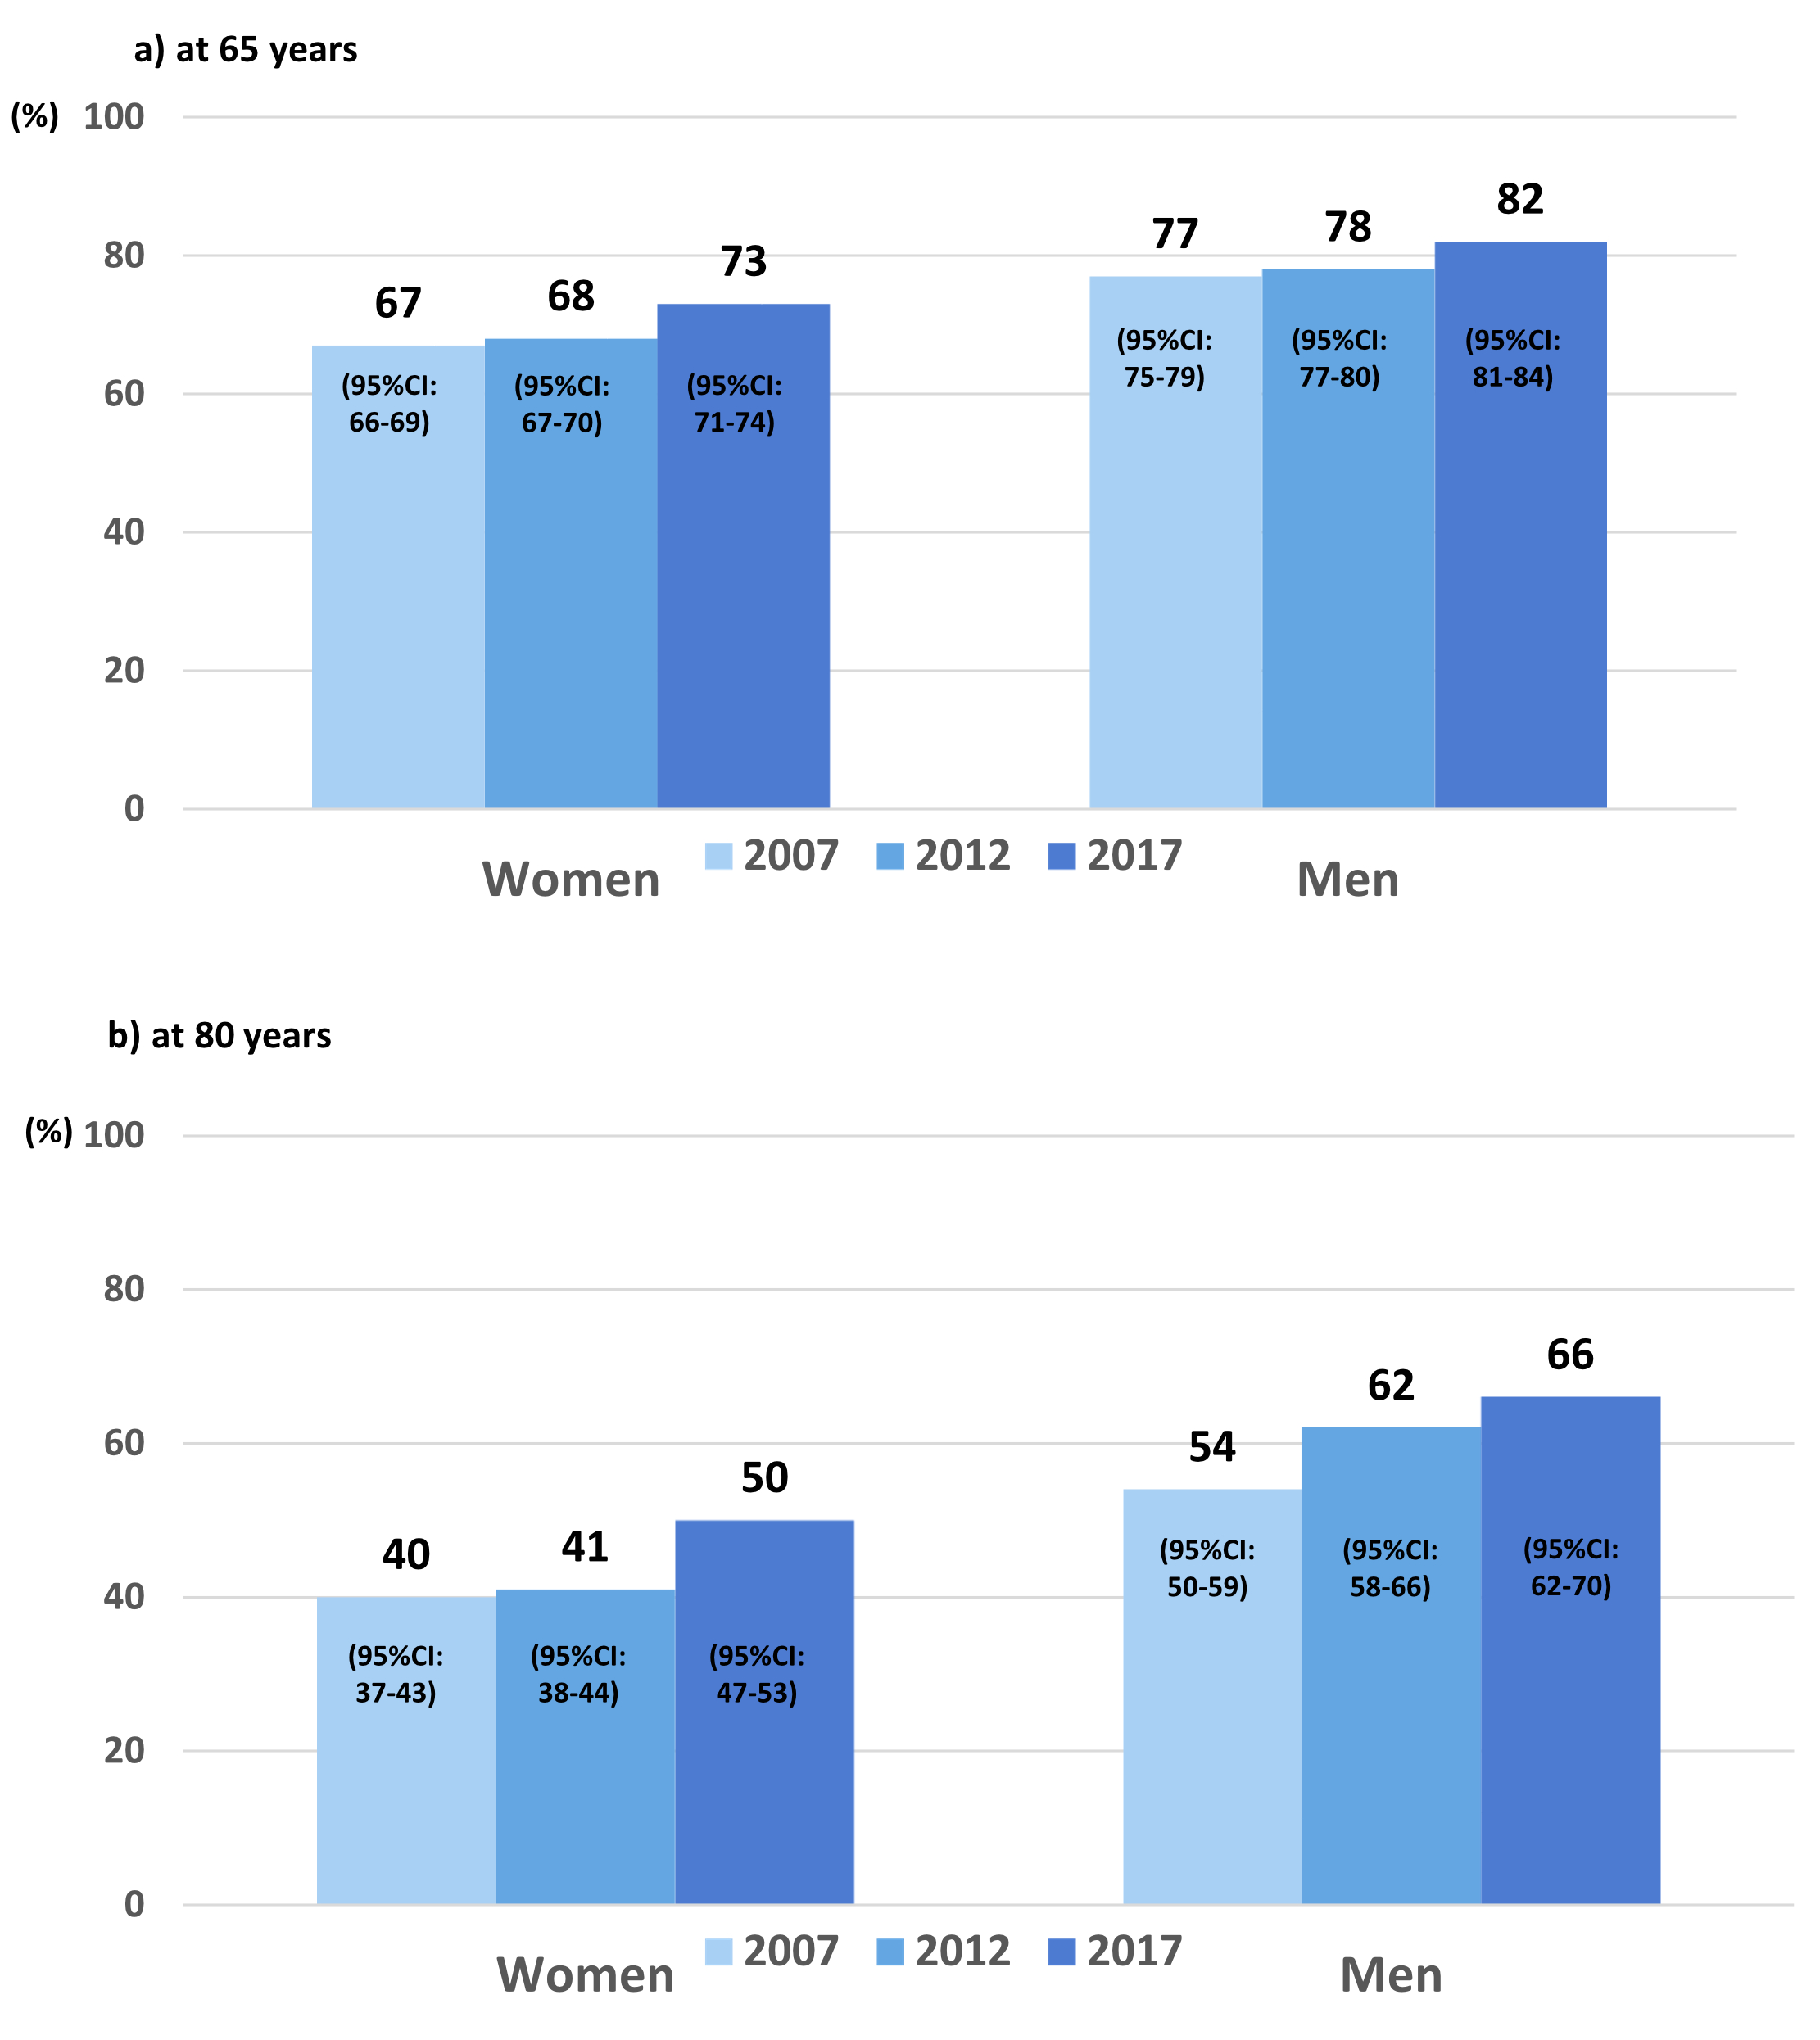
Figure 2 Change in the proportion of disability-free life expectancy in remaining years in women and men, at a) 65 years; b) 80 years of age.
In the context of ageing populations, information regarding change in healthy life expectancy, encompassing both quantity and quality of life, is of utmost interest. This study further extends the available information, as it quantified the change in life expectancy without disability, with mild disability, and with severe disability, which are highly relevant figures when it comes to planning the provision of health and social care. Our study shows that over the past decade, disability-free life expectancy at 65 and 80 years of age continued to increase in Switzerland, while the duration of life with mild or severe disability decreased. These favourable trends were observed in both sexes, and even at 80 years of age. Overall, gains in disability-free life expectancy even outweighed those in life expectancy, reflecting a degree of compression of morbidity.
Findings about increasing disability-free life expectancy slightly differ from those of three European studies that pointed to a stable disability-free life expectancy [11‒13]. In contrast, the gain in disability-free life expectancy of 1.5 to 2 years observed over a 10-year period in the current study appears quite similar to the change observed in the two most comparable studies: in the US study, a one-year increase in disability-free life expectancy at age 65 was noticed between 2000 and 2010 [15], and the study in Denmark reported a two-year increase in disability-free life expectancy at 65 years of age between 2004 and 2010 [14]. This somehow greater gain could be considered to be a catch-up phenomenon as longevity was considerably shorter in Denmark at the beginning of the 2000s compared with Switzerland.
These studies also reported diverging trends in life expectancy with disability, recorded as stable or slightly declining in Northern Europe [11‒14], and slightly increasing in the US [15].
These findings need to be interpreted with caution as the samples, measurement methods, and study period and as duration vary across studies. The results nonetheless show a degree of overall consistency, with a slight compression of morbidity, notably in women living in Northern Europe and in the US.
The favourable trends described in this study reflect a continuing trend of compression of morbidity in Switzerland, previously also shown for the period from 1981 to 2002 [6]. During this period, the portion of life expectancy without severe disabilities increased from 66% to 75% in women and from 79% to 83% in men, accompanied by a decline in life expectancy with disabilities in women only. Potential factors explaining such a favourable change are very diverse, encompassing socioeconomic conditions at the personal and national level, health behaviours, and the healthcare system [8]. The impact of socioeconomic status has been most studied, with a persistent or even expanding gap of 7 to 9 years of life without disability between the most disadvantaged and advantaged groups [24‒27]. As regards health behaviours, a recent study documented that people who avoid smoking, a sedentary lifestyle, obesity and daily alcohol use can live up to 11 years longer without disability than those with two or more of these risk factors [28].
Another contribution of the present study is to show that the favourable trends in disability-free life expectancy and life expectancy with disability were very similar in men and women, and that, despite a larger gain in life expectancy in men, the differences across gender in the portion of life without disability remained essentially unchanged over the study period. These findings contribute new information on this issue as they are consistent with those from the US study [15] but differ from those of studies in Northern Europe, which observed a narrowing gap [12, 13]. Overall, our observation of longer longevity in women but with a longer period of disability is consistent with most other studies. The causes of this female disadvantage remain to be elucidated; biological specificities, as well as differences in behavioural risk factors have been suggested [29].
Similar to other studies on disability-free life expectancy and life expectancy with disability, this work has some limitations. First, the estimates are based on self-reported as opposed to observed disability. However, the use of the same question for each of the three waves under study makes any systematic bias unlikely. Then, even though Sullivan’s method has been criticised because it relies on the prevalence rather than on the incidence of disability, it has been shown to produce estimates similar to those of more accurate multistate methods that rely on rarely available longitudinal data [20, 21]. Finally, the computation of life expectancy with mild disability as life expectancy minus disability-free life expectancy and life expectancy with severe disability relies on the assumption that functional status declines from no disability to mild and then severe disability, although some persons might experience a sudden onset of severe disability. However, this simplification does not affect the estimates of disability-free life expectancy or morbidity compression.
In conclusion, a degree of compression of morbidity has been observed in recent decades in Switzerland. However, future trends in disability-free life expectancy may be impacted by the COVID-19 pandemic. The epidemic appears to have caused only a transient reduction of longevity in Switzerland, already offset in 2021 [30]. Nevertheless, the influence on life expectancy without disability may be stronger, not only because of functional decline in persons who were infected but also as a consequence of the confinement, during which older people became less physically and socially active and hence accumulated risk factors for disability. New studies should be conducted in the coming years to monitor future trends in life expectancy with and without disability.
Data about mortality and from the Swiss Health Survey can be accessed through asking the Federal Office for Statistics [16, 17]. Information about institutionalisation rates are available through the Swiss Health Observatory [22].
The authors thank the participants who answered the Swiss Health Surveys.
Author contributions: JZ, LS-B. and SP designed the analyses. JZ analysed the data. LS-B. drafted the initial manuscript. All authors interpreted the data and results. All authors revised the manuscript.
There was no sponsor for this study.
All authors have completed and submitted the International Committee of Medical Journal Editors form for disclosure of potential conflicts of interest. No potential conflict of interest was disclosed.
1. Fries JF. Aging, natural death, and the compression of morbidity. N Engl J Med. 1980 Jul;303(3):130–5. https://doi.org/10.1056/NEJM198007173030304
2. Manton KG. Changing concepts of morbidity and mortality in the elderly population. Milbank Mem Fund Q Health Soc. 1982;60(2):183–244. https://doi.org/10.2307/3349767
3. Gruenberg EM. The failures of success. 1977. Milbank Q. 2005;83(4):779–800. https://doi.org/10.1111/j.1468-0009.2005.00400.x
4.Lafortune G BG. Trends in severe disability among elderly people: assessing the evidence in 12 OECD countries and the future implications. OECD health working papers. Paris, France: OECD.
5. Freedman VA. Recent trends in disability and functioning among older adults in the United States: A systematic review (vol 288, pg 3140, 2002). JAMA. 2003;289(24):3242.Reference has only first page number. Please provide the last page number if article is longer than one page. (Ref. 5 "Freedman, 2003")
6.Seematter-Bagnoud L PF. The future of longevity in Switzerland: background and perspectives. Lausanne, Switzerland: Institut universitaire de médecine sociale et préventive; 2010.
7. Chatterji S, Byles J, Cutler D, Seeman T, Verdes E. Health, functioning, and disability in older adults—present status and future implications. Lancet. 2015 Feb;385(9967):563–75. https://doi.org/10.1016/S0140-6736(14)61462-8
8. Rechel BJ, McKee M. Living longer, but in better or worse health? European Observatory on Health Systems and Policies. World Health Organization. Copenhagen, Denmark: Regional Office for Europe; 2020.
9. Cambois ER. J.M. Les espérances de vie sans incapacité : un outil de prospective en santé publique. Inf Soc. 2014;183(3):106–14.
10. Spiers GF, Kunonga TP, Beyer F, Craig D, Hanratty B, Jagger C. Trends in health expectancies: a systematic review of international evidence. BMJ Open. 2021 May;11(5):e045567. https://doi.org/10.1136/bmjopen-2020-045567
11. Brønnum-Hansen H, Eriksen ML, Andersen-Ranberg K, Jeune B. Persistent social inequality in life expectancy and disability-free life expectancy: outlook for a differential pension age in Denmark? Scand J Public Health. 2017 Jun;45(4):459–62. https://doi.org/10.1177/1403494816683591
12. Enroth L, Raitanen J, Halonen P, Tiainen K, Jylhä M. Trends of Physical Functioning, Morbidity, and Disability-Free Life Expectancy Among the Oldest Old: Six Repeated Cross-Sectional Surveys Between 2001 and 2018 in the Vitality 90+ Study. J Gerontol A Biol Sci Med Sci. 2021 Jun;76(7):1227–33. https://doi.org/10.1093/gerona/glaa144
13. Sundberg L, Agahi N, Fritzell J, Fors S. Trends in health expectancies among the oldest old in Sweden, 1992-2011. Eur J Public Health. 2016 Dec;26(6):1069–74. https://doi.org/10.1093/eurpub/ckw066
14. Jeune B, Eriksen ML, Andersen-Ranberg K, Brønnum-Hansen H. Improvement in health expectancy at ages 50 and 65 in Denmark during the period 2004-2011. Scand J Public Health. 2015 May;43(3):254–9. https://doi.org/10.1177/1403494815569104
15. Crimmins EM, Zhang Y, Saito Y. Trends Over 4 Decades in Disability-Free Life Expectancy in the United States. Am J Public Health. 2016 Jul;106(7):1287–93. https://doi.org/10.2105/AJPH.2016.303120
16. Statistics FOf. Tables de mortalité en Suisse. Neuchâtel, Switzerland: Federal Office for Statistics 2019. Available from: https://www.bfs.admin.ch/bfs/fr/home/statistiques/population/naissances-deces.html
17. Statistics FOf. L’enquête suisse sur la santé 2017 en bref. Conception, méthode, réalisation. Neuchâtel, Switzerland: Federal Office for Statistics 2018. Available from: https://www.bfs.admin.ch/bfs/fr/home/statistiques/sante/enquetes/sgb.assetdetail.14839330.html
18. Seematter-Bagnoud L, Belloni G, Zufferey J, Peytremann-Bridevaux I, Büla C, Pellegrini S. Espérance de vie et état de santé: quelle évolution récente? Neuchâtel, Switzerland: Obsan Bulletin, Swiss Health Observatory; 2021.
19. Sullivan DF. A single index of mortality and morbidity. HSMHA Health Rep. 1971 Apr;86(4):347–54. https://doi.org/10.2307/4594169
20. Jagger C, Van Oyen H, Robine JM. Health expectancy calculation by the Sullivan method: a practical guide. Nihon University Population Research Institute (NUPRI) Research Paper Series 68. 2014.
21. Barendregt JJ, Bonneux L, van der Maas PJ. How good is Sullivan’s method for monitoring changes in population health expectancies? [Reply]. J Epidemiol Community Health. 1997 Oct;51(5):578–9. https://doi.org/10.1136/jech.51.5.578
22. Observatory SH. Taux de recours aux EMS et maisons pour personnes âgées. Neuchâtel, Switzerland: Swiss Health Observatory 2022 [Available from: https://ind.obsan.admin.ch/fr/indicator/obsan/taux-de-recours-aux-ems-et-maisons-pour-personnes-agees
23. R Core Team. R: A language and environment for statistical computing. Vienna, Austria: R Foundation for Statistical Computing; 2021.
24. Zaninotto P, Batty GD, Stenholm S, Kawachi I, Hyde M, Goldberg M, et al. Socioeconomic Inequalities in Disability-free Life Expectancy in Older People from England and the United States: A Cross-national Population-Based Study. J Gerontol A Biol Sci Med Sci. 2020 Apr;75(5):906–13. https://doi.org/10.1093/gerona/glz266
25. Valverde JR, Mackenbach J, Bopp M, Brønnum-Hansen H, Deboosere P, Kalediene R, et al. Determinants of educational inequalities in disability-free life expectancy between ages 35 and 80 in Europe. SSM Popul Health. 2021 Jan;13:100740. https://doi.org/10.1016/j.ssmph.2021.100740
26. Remund A, Cullati S, Sieber S, Burton-Jeangros C, Oris M; Swiss National Cohort. Longer and healthier lives for all? Successes and failures of a universal consumer-driven healthcare system, Switzerland, 1990-2014. Int J Public Health. 2019 Nov;64(8):1173–81. https://doi.org/10.1007/s00038-019-01290-5
27. Storeng SH, Øverland S, Skirbekk V, Hopstock LA, Sund ER, Krokstad S, et al. Trends in Disability-Free Life Expectancy (DFLE) from 1995 to 2017 in the older Norwegian population by sex and education: the HUNT Study. Scand J Public Health. 2022 Jul;50(5):542–51. https://doi.org/10.1177/14034948211011796
28. Zaninotto P, Head J, Steptoe A. Behavioural risk factors and healthy life expectancy: evidence from two longitudinal studies of ageing in England and the US. Sci Rep. 2020 Apr;10(1):6955. https://doi.org/10.1038/s41598-020-63843-6
29. Oksuzyan A, Brønnum-Hansen H, Jeune B. Gender gap in health expectancy. Eur J Ageing. 2010 Nov;7(4):213–8. https://doi.org/10.1007/s10433-010-0170-4
30. Locatelli IR. Mortality in Switzerland 2020-2021. Lausanne, Switzerland: Center for Primary Care and Public Health (Unisanté), University of Lausanne 2021.
Table S1Disability-free life expectancy (DFLE) and confidence intervals (95% CI) at age 65 years and 80 years, in women and men, years 2007–2012–2017.
| Women | Men | |||||||
| 65 years | 80 years | 65 years | 80 years | |||||
| DFLE | 95% CI | DFLE | 95% CI | DFLE | 95% CI | DFLE | 95% CI | |
| 2007 | 14.5 | 14.2–14.8 | 3.8 | 3.5–3.8 | 14.1 | 13.8–14.4 | 4.4 | 4.1–4.7 |
| 2012 | 14.8 | 14.5–15.1 | 3.9 | 3.6–4.2 | 15.0 | 14.7–15.3 | 5.2 | 4.8–5.5 |
| 2017 | 16.0 | 15.7–16.4 | 4.9 | 4.6–5.1 | 16.2 | 15.9–16.5 | 5.8 | 5.5–6.1 |