The Swiss neighbourhood index of socioeconomic position: update and re-validation
DOI: https://doi.org/10.57187/smw.2023.40028
Radoslaw
Panczaka, Claudia
Berlina, Marieke
Voorpostelb, Marcel
Zwahlena, Matthias
Eggeracd
a
Institute of Social and Preventive Medicine, University of Bern, Bern,
Switzerland
b Swiss
Centre of Expertise in the Social Sciences (FORS), Lausanne, Switzerland
c
Population Health Sciences, Bristol Medical School, University of Bristol, UK
d Centre
for Infectious Disease Epidemiology and Research, University of Cape Town, Cape
Town, South Africa
Summary
BACKGROUND:
The widely used Swiss neighbourhood index of socioeconomic position (Swiss-SEP
1) was based on data from the 2000 national census on rent, household head
education and occupation, and crowding. It may now be out of date.
METHODS:
We created a new index (Swiss-SEP 2) based on the 2012–2015 yearly micro
censuses that have replaced the decennial house-to-house census in Switzerland
since 2010. We used principal component analysis on neighbourhood-aggregated
variables and standardised the index. We also created a hybrid version
(Swiss-SEP 3), with updated values for neighbourhoods centred on buildings
constructed after the year 2000 and original values for the remaining
neighbourhoods.
RESULTS:
A total of 1.54 million neighbourhoods were included. With all three indices, the
mean yearly equivalised household income increased from around 52,000 to 90,000
CHF from the lowest to the highest index decile. Analyses of mortality were
based on 33.6 million person-years of follow-up. The age- and sex-adjusted
hazard ratios of all-cause mortality comparing areas in the lowest Swiss-SEP decile
with areas of the highest decile were 1.39 (95% confidence interval [CI] 1.36–1.41),
1.31 (1.29–1.33) and 1.34 (1.32–1.37) using the old, new and hybrid indices,
respectively.
DISCUSSION:
The Swiss-SEP indices capture area-based SEP at a high resolution and allow the
study of SEP when individual-level SEP data are missing or area-level effects
are of interest. The hybrid version (Swiss-SEP 3) maintains high spatial
resolution while adding information on new neighbourhoods. The index will
continue to be useful for Switzerland’s epidemiological and public health
research.
Introduction
The
association of socioeconomic position with health has long been recognised. The
civil servant turned social reformer Edwin Chadwick reported that in 1842 Great
Britain, the average age at death was 45 years in “gentlemen and persons
engaged in professions, and their families”, but only 16 years in “mechanics, servants and labourers, and their families” [1]. The health of populations has improved
dramatically since then, but mortality and socioeconomic position continue to
be associated [2]. For example, during the
first decade of the 21st century, an analysis using the original Swiss neighbourhood
index of socioeconomic position (Swiss-SEP 1) found substantial variation in
life expectancy depending on the social standing of neighbourhoods [3, 4].
Area-based
measures of socioeconomic position (SEP) are used to examine the impact of the
socioeconomic characteristics of an area on health-related outcomes beyond
individual characteristics and behaviours. They can also be used as a proxy for
missing individual-level data, such as in the context of adjusting for
socioeconomic factors that affect health in epidemiological studies. The
Swiss-SEP 1 index was developed using data from the 2000 census. It is based on
four domains that measure different aspects of the socioeconomic situation of
Swiss households: rent per square metre, education level, occupation and
overcrowding [3, 5]. Rent is related to income,
which in turn influences exposures that affect health and health services
access [5–7]. Households with higher levels of education may lead healthier
lifestyles. Occupation captures occupational exposures such as work stress and
specific workplace exposures [8]. Crowded households tend to
have fewer economic resources. Direct impacts of crowding on health may also
exist, such as spreading infectious diseases. The Swiss-SEP 1 [3] includes 1.27 million
overlapping neighbourhoods of around 50 households.
Since
its publication in 2012 [3], the index has become a
valuable tool in epidemiological and clinical research to examine the
importance of socioeconomic position or adjust for its potential confounding
effect. For example, in recent months, it has been used in studies of DNA
methylation profiles associated with vegetation (greenness) around the residential
address [9], dietary patterns across
Swiss language regions [10] and respiratory health in
schoolchildren [11]. The continued use of an
index of socioeconomic position based on data from 2000 raises the question of
whether the tool is still fit for purpose. Over the past two decades,
Switzerland’s population has grown from 7.20 million to 8.67 million [12]. Some areas might have
changed their status, for example, due to the construction of new residential
areas, the ‘gentrification’ of existing neighbourhoods, or new roads or public
transportation links.
In
2010, Switzerland moved from decennial censuses to a system of yearly surveys
(micro censuses) [3]. Therefore, the individual- and household-level
information used to construct the Swiss-SEP is no longer collected for the
entire population but only for a random sample of around 200,000 residents per
year. This prevents an automatic update of the index. Here, we describe the changing
data ecosystem, construct new versions of the Swiss-SEP index, and validate the
old and new versions against independent income and mortality data.
Materials
and methods
We
followed the five steps undertaken in the original work to develop the revised
version of the index (Swiss-SEP 2) [3]: (1) define neighbourhoods
of around 50 households, (2) characterise these neighbourhoods
socioeconomically, (3) develop the index, (4) examine the index’s construct validity
using independent income data and (5) examine mortality by index levels. Full
details of the data preparation steps, exclusion and inclusion criteria, and the
size of datasets are provided in the online appendix.
Definition of neighbourhoods
As
in developing the original index, we used all residential buildings in
Switzerland as centres of neighbourhoods. For each building, a neighbourhood
was identified consisting of the nearest (based on the road network) 50
households. In rare cases where fewer than 50 households were found within a 20-kilometre
radius, the neighbourhood could consist of fewer households. If the 50th
household was in a building with more than one household, the other households
in that building were also included, resulting in a neighbourhood with more
than 50 households. Since each building was in turn the centre of the
neighbourhood, neighbourhoods with overlapping boundaries were formed. We then
collected the data from four annual waves of micro censuses from 2012 to 2015.
We decided against using data from 2010 and 2011, the first two micro censuses,
due to data quality issues and missing information. The combined dataset from
the four micro censuses allowed us to replicate the original procedure for
defining and characterising neighbourhoods. Naturally, using a sample of individuals
and their households instead of a complete census meant that the geographical
size of areas had to be increased to still include the 50 closest households included
in the surveys.
Socioeconomic standing of neighbourhoods
We
used the same four domains that were the basis of the original index to
describe neighbourhoods. Housing and income domains remained unchanged, based
on the rent per square metre in three- to five-room flats, and crowding defined
as the mean number of persons per room, counting bed- and living rooms [3]. The micro census did not specify
the head of the household. Instead, the information on the adult respondent was
used. In addition, the original categorisation of occupations developed by the
Swiss Federal Statistical Office was no longer available for all survey years.
Therefore, we used the International Standard Classification of Occupations
data to categorise occupations [13].
Construction and combination of indexes
As
for the previous index version, we used principal component analysis on
neighbourhood-aggregated indicators to construct the Swiss-SEP 2. The four
variables described were combined using principal component analysis. We
combined the loadings of the first principal component to obtain a value for
the socioeconomic position of a neighbourhood. The loadings were similar to the
original index and positive for occupation, education and persons per room,
with values of 0.6054, 0.5902 and 0.2401, respectively, and negative for rent
(-0.4770). Higher values represented neighbourhoods of higher socioeconomic
position. The analysis was weighted by the number of households to account for
differences in area size and standardised to a range of 0 to 100. In addition
to the new index, we created a hybrid version of the index (Swiss-SEP 3), which
included updated values for new neighbourhoods around buildings built after 2000
and the original values for the remaining areas.
Validation using household panel data
We
re-examined the construct validity of the new Swiss-SEP 2 and hybrid Swiss-SEP
3 indices by exploring their association with income data collected by the Swiss
Household Panel, a longitudinal study following a random sample of Swiss
households [14]. We included the
participants from the 1999, 2004 and 2013 recruitment waves and geocoded the
residences of 7,252 (98.6%) households that participated in one or several
waves and completed the questionnaire in 2014. The geocoding was based on the Swiss
federal register of buildings and dwellings [15]. We used the same variables
as in the original study [3], i.e. self-reported equivalised
yearly household income in Swiss francs (CHF), and calculated the yearly mean
equivalised household income, which adjusts for family size [16]. Information about
equivalised income was available for 7,193 households (99.1%), including 588 with
imputed income data. Imputation of missing income data in the Swiss Household
Panel uses cross-sectional and longitudinal methods, as described in detail in
a working paper [17]. In further analyses
presented in the online appendix, we examined data on expenses, contributions
to tax-free private pension schemes and reception of financial help.
Mortality across deciles of indices
Finally, we updated all-cause and cause-specific mortality analyses [3]. We used the data from the Swiss National cohort, a population-based cohort of the Swiss resident population based on census data linked to mortality, live birth and emigration records [18–20]. The dataset consisted of 5,714,470 individuals aged 30 years or older. We excluded 400,357 (7.0%) individuals with no link to a residential building, 61,453 (1.1%) individuals with missing building ID and 2,944 (0.05%) individuals with missing civil status. Finally, we excluded 627 (0.2%) of 304,789 deaths due to ineligible death dates (deaths recorded before 2012). The final dataset consisted of 5,249,089 individuals and 304,162 deaths.
We
examined mortality from lung cancer (ICD-10 codes C33–C34), breast cancer
(ICD-10 code C50), prostate cancer (ICD-10 code C61), respiratory diseases
(ICD-10 codes J00–J99), cardiovascular diseases (ICD-10 codes I00–I99), myocardial
infarction (ICD-10 codes I21–I22), stroke (ICD-10 codes I60–I64), traffic
accidents (ICD-10 codes V01–V99) and suicide (ICD-10 codes X60–X84). The updated
analysis was based on 304,162 deaths recorded from 2012 to 2018 among 5.25
million individuals aged 30 years or older. We used Cox proportional hazard
regression to compare mortality by deciles of the three versions of the Swiss-SEP
index. We measured time from January 1, 2012, to the earliest of death,
emigration or December 31, 2018. Models were adjusted for age (by using age as
the time scale) and sex to compare them with the previous analyses. Fully
adjusted analyses were no longer possible due to a lack of individual-level
education and professional status information. In the online appendix, we
present additional models adjusted for age, sex, nationality, civil status,
language region and level of urbanisation of place of residence. The results are
presented as hazard ratios with 95% CIs. We did not test for proportional
hazards or interpret hazard ratios obtained from Cox models as a weighted
average of the true hazard ratios over the entire period of follow-up [21].
We performed
analyses in Stata (version 15, Stata Corporation, College Station, TX, USA), R
(version 4.2.0, R Foundation for Statistical Computing, Vienna, Austria) and
ArcGIS (version 10.5, Environmental Systems Research Institute, Redlands, CA,
USA) software. The external libraries used included ISKO in Stata [22] and tidyverse 1.31 [23] and sf 1.08 [24] in R. The study was performed
within the framework of the Swiss National Cohort, with ethics approval from the
Ethics Committee of the Canton Bern (No. 153/2014).
Results
The dataset of residential buildings consisted of 1,560,993 records. We excluded 20,405 (1.3%) non-residential buildings and two buildings without neighbours on the road network and combined 13,411 (0.9%) duplicate entries. The final dataset comprised 1,527,175 residential buildings and neighbourhoods. The dataset of the four micro censuses from 2012 to 2015 comprised 1,125,356 individuals. We excluded 167,726 (14.9%) individuals not linked to any eligible household or building, 56,367 (5.0%) children and adolescents below the age of 19 years and 2,597 (0.2%) people with temporary residence permits. Additionally, we excluded 6,539 (0.6%) duplicate records of individuals who participated in more than one micro census, retaining the latest record. The mean size of overlapping neighbourhoods was 50.5 households (SD 1.31) and 131 individuals (SD 16.0), similar to the old index [3]. Compared to the old index [3], the median of the mean distance by road between the reference building and the other buildings within the neighbourhood of around 50 households increased, from 131 m to 272 m.
The
first principal component retained to construct the index explained 48.9% of the
total variance, with similar loadings to those obtained previously [3]. The hybrid version of the
index (Swiss-SEP 3) retained values of the original index for 1.31 million
neighbourhoods. It updated the values for 235,161 (15.3%) areas centred on
buildings constructed after 2000 (see online appendix for further details). As
expected, the two variables used in constructing the index – educational and
professional status – showed a steep gradient across the index deciles (table
1; using Swiss-SEP 3).
Table 1Characteristics of the sample of the resident population in Switzerland across the first (lowest SEP), fifth and tenth (highest SEP) deciles of the hybrid version of the Swiss neighbourhood index of socioeconomic position (Swiss-SEP 3), Switzerland.
|
Characteristic
|
Index
decile
|
Total
|
|
1
|
5
|
10
|
|
|
N
(%)
|
N
(%)
|
N
(%)
|
N
(%)
|
| Gender |
Male |
49782
(48.6) |
41660
(47.3) |
36229
(47.3) |
424130
(47.5) |
| Female |
52601
(51.4) |
46325
(52.7) |
40309
(52.7) |
467997
(52.5) |
| Age
(years) |
19–34 |
26569
(26.0) |
20018
(22.8) |
13510
(17.7) |
200604
(22.5) |
| 35–49 |
30416
(29.7) |
25099
(28.5) |
21905
(28.6) |
255462
(28.6) |
| 50–64 |
25016
(24.4) |
22338
(25.4) |
20522
(26.8) |
228477
(25.6) |
| Above
65 |
20382
(19.9) |
20530
(23.3) |
20601
(26.9) |
207584
(23.3) |
| Civil
status |
Single |
25912
(25.3) |
23574
(26.8) |
19571
(25.6) |
235941
(26.4) |
| Married |
60671
(59.3) |
50077
(56.9) |
46283
(60.5) |
517255
(58.0) |
| Widowed |
6156
(6.0) |
5561
(6.3) |
4120
(5.4) |
53453
(6.0) |
| Divorced |
9643
(9.4) |
8773
(10.0) |
6564
(8.6) |
85477
(9.6) |
| (Missing) |
1
(0.0) |
0
(0.0) |
0
(0.0) |
1
(0.0) |
| Nationality |
Swiss |
69874
(68.2) |
70681
(80.3) |
62514
(81.7) |
703676
(78.9) |
| Foreigner |
32509
(31.8) |
17304
(19.7) |
14024
(18.3) |
188451
(21.1) |
| First
main language |
German |
40613
(39.7) |
52825
(60.0) |
53580
(70.0) |
518985
(58.2) |
| French |
34020
(33.2) |
20684
(23.5) |
15712
(20.5) |
226063
(25.3) |
| Italian |
12614
(12.3) |
7659
(8.7) |
1355
(1.8) |
69155
(7.8) |
| Other |
15136
(14.8) |
6817
(7.7) |
5891
(7.7) |
77924
(8.7) |
| Education |
Primary
education or less |
37232
(36.4) |
18745
(21.3) |
6134
(8.0) |
188309
(21.1) |
| Upper
secondary level |
46845
(45.8) |
45382
(51.6) |
31333
(40.9) |
434965
(48.8) |
| Tertiary
level |
18306
(17.9) |
23858
(27.1) |
39071
(51.0) |
268853
(30.1) |
| Professional
status |
Top
management and independent professions |
1320
(1.3) |
1582
(1.8) |
3833
(5.0) |
20548
(2.3) |
| Other
self-employed |
3480
(3.4) |
2872
(3.3) |
2491
(3.3) |
29047
(3.3) |
| Professionals
and senior management |
3599
(3.5) |
5233
(5.9) |
9250
(12.1) |
60297
(6.8) |
| Supervisors/low-level
management and skilled labour |
24398
(23.8) |
23411
(26.6) |
15025
(19.6) |
223131
(25.0) |
| Unskilled
employees and workers |
7165
(7.0) |
3000
(3.4) |
749
(1.0) |
31914
(3.6) |
| In
paid employment, not classified elsewhere |
4005
(3.9) |
2648
(3.0) |
1545
(2.0) |
26426
(3.0) |
| Unemployed/job-seeking |
3319
(3.2) |
1981
(2.3) |
1293
(1.7) |
20377
(2.3) |
| Not
in paid employment |
25702
(25.1) |
22239
(25.3) |
20098
(26.3) |
225064
(25.2) |
| (Missing) |
29395
(28.7) |
25019
(28.4) |
22254
(29.1) |
255323
(28.6) |
| Level
of urbanisation |
Urban |
27683
(27.0) |
22694
(25.8) |
26015
(34.0) |
249565
(28.0) |
| Peri-urban |
30417
(29.7) |
39056
(44.4) |
49218
(64.3) |
408700
(45.8) |
| Rural |
44283
(43.3) |
26235
(29.8) |
1305
(1.7) |
233862
(26.2) |
For
instance, the proportion of individuals with primary education or less was four
and half times higher in the neighbourhoods of decile 1 than in decile 10. On
the other hand, the highest professional category of employment was nearly four
times less prevalent. Variables not used in the construction of the index
directly but also connected to socioeconomic position also varied – for
instance, the proportion of foreign residents in the neighbourhood decreased
from 31.8% to 18.3% from decile 1 to decile 10. These results were similar
across the other versions of the index (see online appendix) and resembled findings
from the original work [3]. Additionally, the spatial
distribution of the new (Swiss-SEP 2) and hybrid (Swiss-SEP 3) indices largely
followed the original study’s findings (fig. 1). Neighbourhoods of
higher SEP continued to be concentrated around the urban centres of Basel, Bern,
Geneva, Lausanne and Zurich and their surroundings and along Lake Leman and
both sides of Lake Zurich. The areas of lower SEP were concentrated in rural
areas of northeast and central Switzerland, in the arc of the Jura and most of the
Alpine valleys.
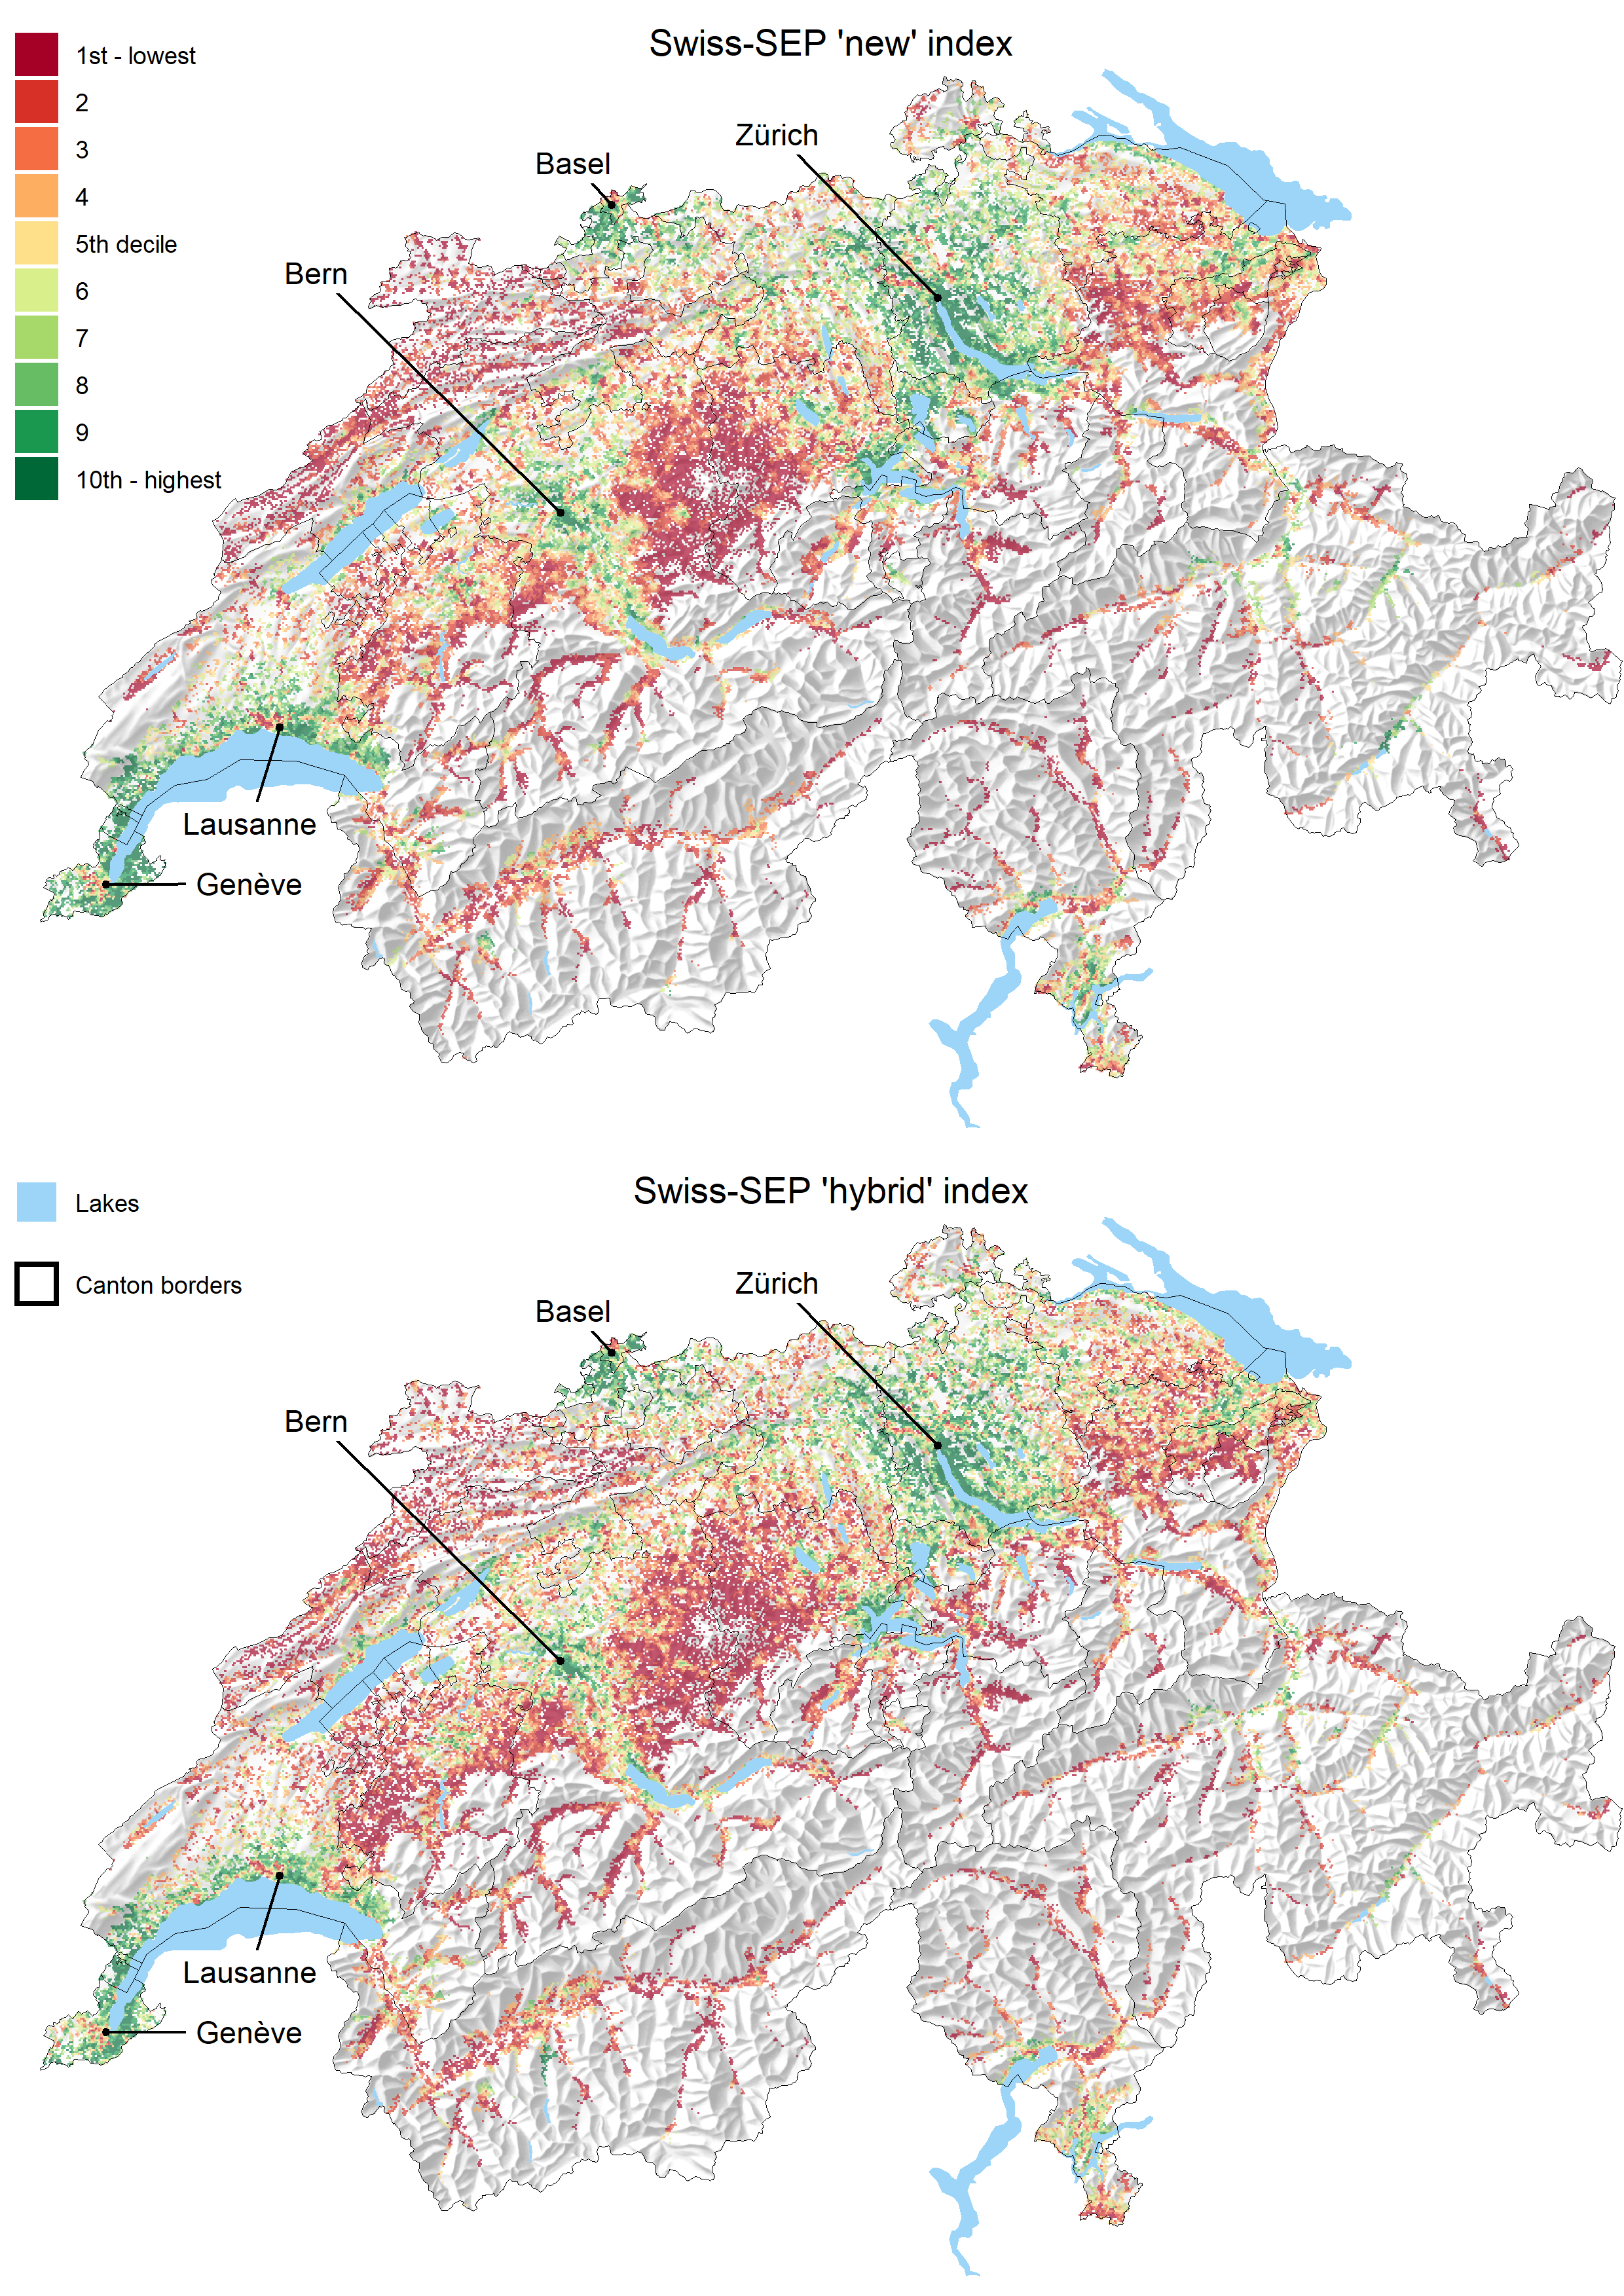
Figure 1 Map of the new (Swiss-SEP 2) and hybrid (Swiss-SEP 3) indices. The original values of 1.54 million neighbourhoods were aggregated into a hexagonal grid with a cell size of 500 m to improve the figure’s clarity. Each grid displays the median value of index deciles.
For
all three versions of the Swiss-SEP index, the yearly equivalised household
income from the Swiss Household Panel increased with increasing Swiss-SEP
decile (fig. 2). For instance, the
median income in 2013 for the analysis of the hybrid index rose from 55,000 CHF
among households in the 1st Swiss-SEP decile to 88,000 CHF in the 10th decile. The
corresponding range in the previous analysis was slightly less extreme (from 42,000
CHF to 72,000 CHF). The other financial characteristics analysed were closely similar
to the original analysis [3] (see online appendix).
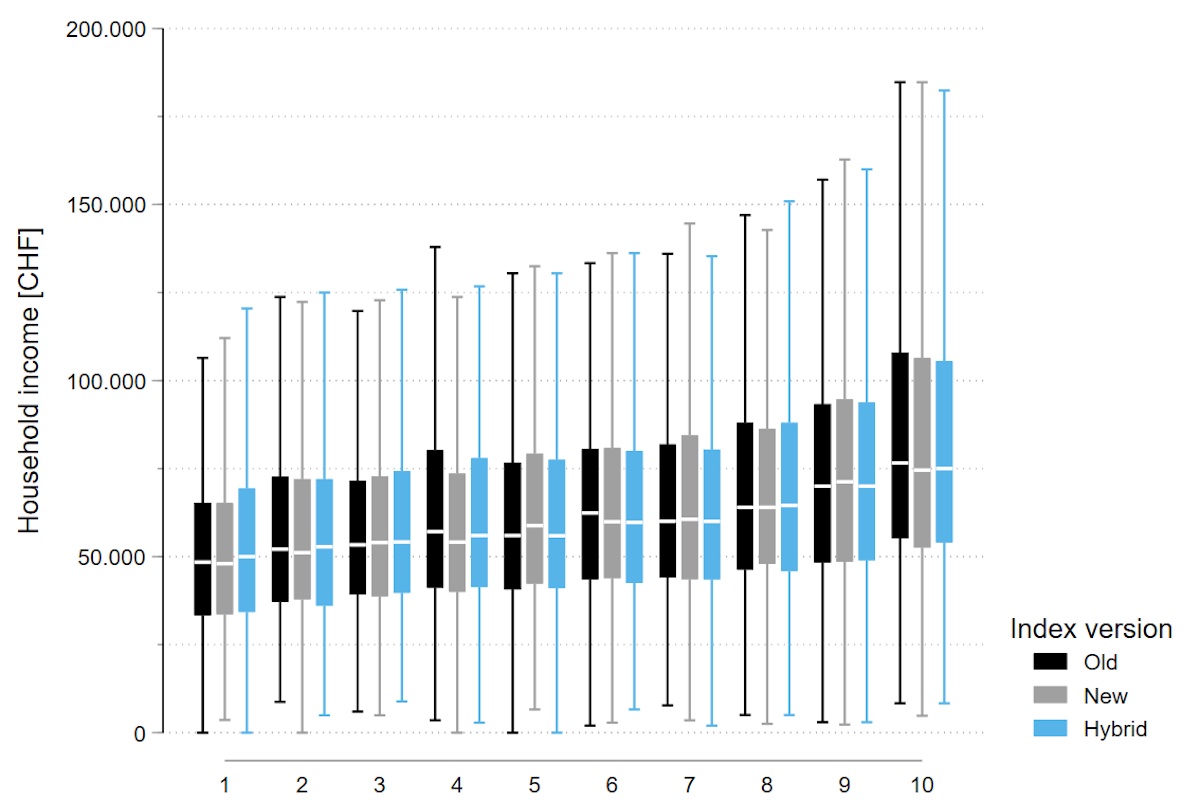
Figure 2 Box plots of the distribution of equivalised yearly household income across the deciles of three indices. Data from 7,193 Swiss Household Panel participants who provided information or had imputed information on the income questions in 2014. Boxplots exclude outliers for better visibility of the central distribution. See online appendix for more details.
The Swiss National Cohort dataset used for the mortality analyses consisted of 5,714,470 individuals aged 30 years or older. We excluded 400,357 (7.0%) individuals with no link to a residential building, 61,453 (1.1%) individuals with missing building ID and 2,944 (0.05%) individuals with missing civil status. Finally, we excluded 627 (0.2%) of 304,789 deaths due to an ineligible date of death (death recorded before 2012). The final dataset consisted of 5,249,089 individuals and 304,162 deaths, with 33.6 million person-years of follow-up. Both the old and updated Swiss-SEP indices were associated with all-cause mortality and cause-specific mortality. The age- and sex-adjusted hazard ratios of all-cause mortality comparing areas in the lowest decile of the Swiss-SEP with areas in the highest decile were 1.39 (95% CI 1.36–1.41),1.31 (95% CI 1.29–1.33) and 1.34 (95% CI 1.32–1.37), using the Swiss-SEP 1, Swiss-SEP 2 and Swiss-SEP 3 indices, respectively. A gradient existed across deciles (fig. 3).
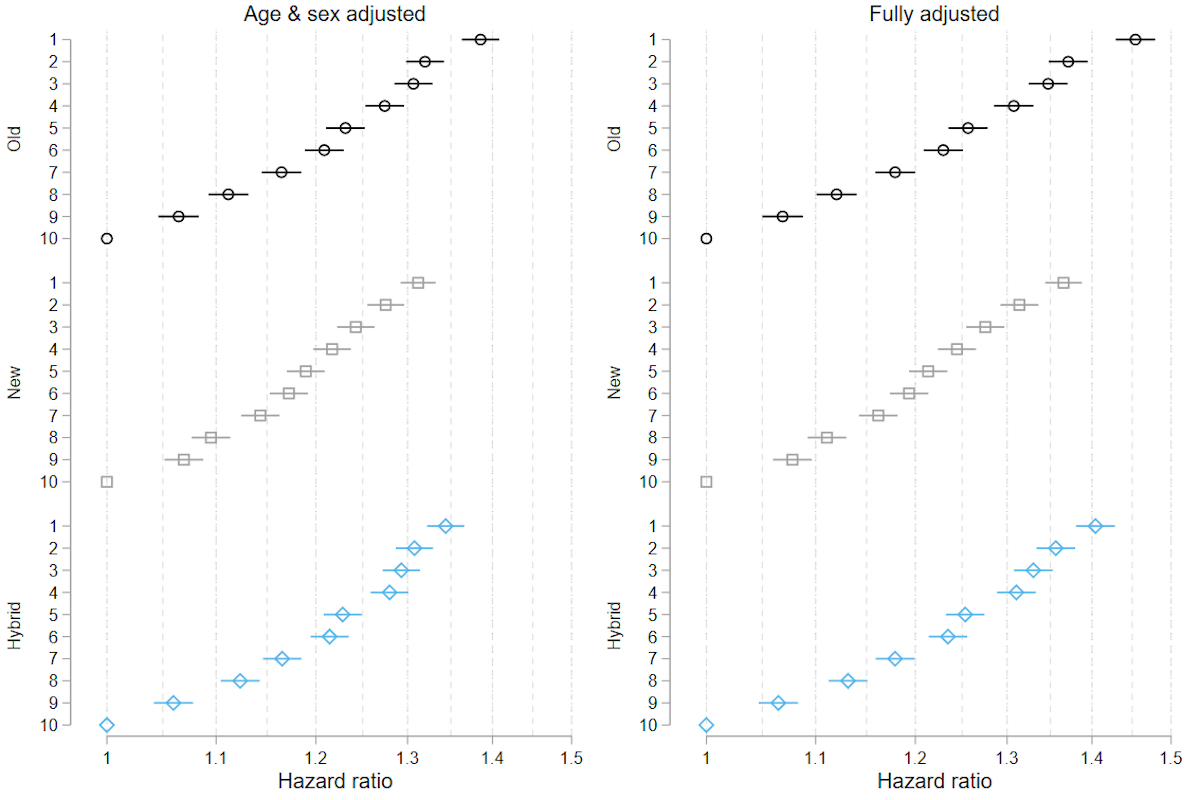
Figure 3 Hazard ratios of all-cause mortality across deciles of the three versions of the Swiss-SEP indices.
Analyses based on Swiss National Cohort data on 304,000 deaths between 2012 and 2018 among 5.25 million individuals aged 30 or older. Fully adjusted analyses included age, sex, nationality, civil status, language region and level of urbanisation. Group 10 (highest SEP index) on the Y-axis is the reference group for all models.
Slightly stronger associations were observed in the
fully adjusted models. In the cause-specific mortality analyses, markedly
stronger associations in the same direction were observed for lung cancer,
respiratory diseases and traffic accidents (table 2).
Table 2Hazard ratios of death from all causes and selected causes in the Swiss resident population comparing the first decile (lowest SEP) of different versions of the Swiss neighbourhood index of socioeconomic position (Swiss-SEP) to the tenth decile (highest SEP). Source: Swiss National Cohort, 2001–2008 [3] and 2012–2018.
|
Previous analysis (2001–2008)
|
Updated analysis (2012–2018)
|
|
Swiss-SEP 1
|
Swiss-SEP 1
|
Swiss-SEP 2
|
Swiss-SEP 3
|
| All causes |
1.38 (1.36–1.41) |
1.39 (1.36–1.41) |
1.31 (1.29–1.33) |
1.34 (1.32–1.37) |
| Lung cancer |
1.83 (1.71–1.95) |
1.93 (1.79–2.08) |
1.79 (1.67–1.92) |
1.82 (1.69–1.96) |
| Breast cancer |
0.93 (0.85–1.02) |
1.09 (0.97–1.22) |
1.01 (0.91–1.13) |
1.04 (0.93–1.17) |
| Prostate cancer |
1.17 (1.07–1.28) |
1.15 (1.03–1.29) |
1.13 (1.02–1.26) |
1.14 (1.02–1.27) |
| Cardiovascular disease |
1.48 (1.44–1.51) |
1.49 (1.44–1.54) |
1.38 (1.34–1.43) |
1.44 (1.39–1.49) |
| Myocardial infarction |
1.68 (1.57–1.80) |
1.64 (1.48–1.80) |
1.53 (1.40–1.67) |
1.55 (1.41–1.70) |
| Stroke |
1.28 (1.20–1.36) |
1.25 (1.14–1.36) |
1.25 (1.15–1.35) |
1.22 (1.12–1.33) |
| Respiratory disease |
1.99 (1.87–2.12) |
1.81 (1.68–1.94) |
1.63 (1.53–1.74) |
1.72 (1.60–1.85) |
| Traffic accidents |
2.42 (1.94–3.01) |
1.80 (1.36–2.39) |
2.13 (1.59–2.86) |
1.89 (1.43–2.51) |
| Suicide |
0.86 (0.78–0.95) |
1.32 (1.14–1.51) |
1.31 (1.15–1.49) |
1.29 (1.12–1.48) |
Little
evidence existed for an association with breast cancer mortality. Notably, the
association of the new index tended to be slightly weaker than the association
with either the old or hybrid index. Estimates based on the old index were
similar for the earlier (2001–2008) and later (2012–2018) periods, except for
suicide. In the earlier period, suicide was less common in areas with higher
socioeconomic status, whereas in the later period, suicide was more common in
these areas.
Discussion
We updated
the Swiss-SEP index, an area-based index of socioeconomic position widely used in
Switzerland. We developed a new version of the index based on the micro census
data with reduced spatial resolution. A hybrid version uses the original index
values for buildings constructed up to 2000 and new values for buildings constructed
since then. An update was deemed necessary because the old version of the index
was based on census data collected in 2000, more than 20 years ago. It was
complicated by the fact that Switzerland, like several other European
countries, changed from a complete, house-to-house census every 10 years to an
administrative register–based census combined with annual surveys (micro
censuses) of around 200,000 persons at the 2011 census round [25].
Here,
we demonstrate the feasibility of creating a new index using more limited information
than what was available in the national house-to-house census conducted in 2000.
All three versions of the index had construct validity, with household income
increasing with higher socioeconomic position. Further, a gradient existed across
Swiss-SEP index deciles for all-cause mortality and mortality from several
specific causes, independently of the version of the index used: old (Swiss-SEP
1), new (Swiss-SEP 2) or hybrid (Swiss-SEP 3).
The
new Swiss-SEP 2 index uses more recent data from the micro censuses; the
disadvantage is lower resolution than the old Swiss-SEP 1. In our previous
analysis [3], we repeated analyses using
mean values of the index for local authorities and urban districts, i.e. much
larger areas. As expected, the association with mortality became considerably
weaker. A trend in this direction could also be observed in the present study
when using the new index. However, the differences were small, and confidence
intervals overlapped widely. Among the different dimensions of socioeconomic
position, income appears to be most strongly associated with health,
particularly in older age [26]. Interestingly, in our
evaluation of construct validity, the association of the Swiss-SEP index with
independent household income data from a panel study was similar for all three
versions of the Swiss-SEP index [3].
The
Swiss-SEP is the only small-area index of socioeconomic position available for
Switzerland. The Socioeconomic Deprivation Index (SDI) developed by Spycher et al. was based on
the much larger MedStat regions (705 regions with mean populations of 12,000
people) [27]. The objective was to
examine the association of socioeconomic and cultural factors with avoidable hospitalisations
for chronic and acute conditions. Vallarta-Robledo et al. used household income
data from Lausanne’s 2009 census to examine the spatial association of neighbourhood
socioeconomic position with tobacco consumption and changes in consumption [28]. Similarly, Mongin et al. used
income and other data from the statistical office of Geneva to characterise the
socioeconomic position of neighbourhoods of around 1,000 people and examine
socioeconomic inequities in COVID-19 incidence, mortality and access to tests [29]. A similar analysis at the
national level used the Swiss-SEP 3 index [30].
Which
index should be used today in Switzerland for research at the national level on
the importance of the socioeconomic environment on health outcomes or research
with another focus aiming to adjust for the socioeconomic position? Our results
indicate that the socioeconomic position of neighbourhoods in Switzerland has changed
relatively little in the past 20 years, at least in relative terms. However, the
population has increased, and new buildings and neighbourhoods have sprung up.
Therefore, using the hybrid version of the index (Swiss-SEP 3) seems to be a
reasonable choice, preserving the original index’s higher resolution while
accommodating new neighbourhoods. In recent years, few high-resolution
area-based datasets relevant to SEP have become available in Switzerland.
Commercially available but, to our knowledge, unvalidated data on purchasing
power have become available, but only at a high level of aggregation, at the
level of municipalities [31]. Alternative data sources
such as detailed data on car ownership [32], mobile phones [33] or social media data [34] or data on specific
environmental exposures from high-resolution satellite images [35] might offer opportunities in
the future. Finally, the availability of yearly micro censuses allows updating
indices more frequently with new data while also improving resolution [36].
The
new versions of the Swiss-SEP inherited the limitations present in the original
work. Switzerland still does not have access to any high-resolution and high-coverage
data about income at the individual level. Such data are inherently difficult
to obtain in the Swiss context, where income information is highly sensitive.
In the absence of access to other data sources on income, rent remains the only
viable alternative. To combine indices, we continued to rely on principal
component analysis to create the index. Other methods are available, but no
consensus exists on best practices or guidelines for developing such indices [37].
In
conclusion, despite the sparser data, we demonstrated the feasibility of
updating the Swiss-SEP within the new micro census system adopted by
Switzerland in 2020. The three versions of the area-based Swiss-SEP index
appear to be similarly valid. The hybrid version maintains the high spatial
resolution of the old version while adding information on new neighbourhoods
around buildings constructed since 2000. The family of Swiss-SEP indices will continue
to support research on socioeconomic position and health whenever data on
individual-level socioeconomic status are missing or the contextual effect of
area-based socioeconomic position is of interest. We will make all three
versions of the Swiss-SEP index available to interested researchers on a
dedicated website.
Data access
The code used to produce the main analyses and the appendix is available online at https://github.com/RPanczak/SNC_Swiss-SEP2. The data are the property of the Swiss Federal Statistical Office (SFSO) and can only be made available by legal agreements with the SFSO. After approval by the SNC Scientific Board, a contract with the SFSO allows researchers to receive analysis files for replication of the analysis. Access to the final dataset of the Swiss-SEP is possible after signing a contract with the SNC. Interested researchers, please visit the BORIS portal at https://doi.org/10.48620/110.
Acknowledgments
We thank the Swiss Federal Statistical Office for providing mortality and census data and for the support over many years, which made the Swiss National Cohort and this study possible. The authors would like to thank Ursina Kuhn for her helpful comments.
Contributorship statement: RP, MZ and ME conceived the study. RP, MZ and ME drafted the first version of the manuscript. RP and CB did all data management, and RP and MZ did all statistical analyses. All authors contributed to the interpretation of data and read and approved the final manuscript.
Prof. Dr. med. Matthias Egger
Institute of Social and Preventive
Medicine
University of Bern
Mittelstrasse 43
CH-3012 Bern
matthias.egger[at]ispm.unibe.ch
References
1. Chadwick E. Report on the Sanitary Condition of the Labouring Population of Great Britain, 1842. Edinburgh: Edinburgh University Press; 1965.
2. Smith GD, Egger M. Socioeconomic differences in mortality in Britain and the United States. Am J Public Health. 1992 Aug;82(8):1079–81. https://doi.org/https://doi.org/2105/AJPH.82.8.1079
3. Panczak R, Galobardes B, Voorpostel M, Spoerri A, Zwahlen M, Egger M; Swiss National Cohort and Swiss Household Panel. A Swiss neighbourhood index of socioeconomic position: development and association with mortality. J Epidemiol Community Health. 2012 Dec;66(12):1129–36. https://doi.org/https://doi.org/1136/jech-2011-200699
4. Moser A, Panczak R, Zwahlen M, Clough-Gorr KMK, Spoerri A, Stuck AEAE, et al. What does your neighbourhood say about you? A study of life expectancy in 1.3 million Swiss neighbourhoods. Journal of Epidemiology & Community Health 2014;68:1125-32. doi: https://doi.org/https://doi.org/1136/jech-2014-204352. https://doi.org/https://doi.org/https://doi.org/1136/jech-2014-204352.
5. Galobardes B, Shaw M. Lawlor D a, Lynch JW, Davey SG, Davey Smith G. Indicators of socioeconomic position (part 1). J Epidemiol Community Health. 2006;60:95–101. https://doi.org/https://doi.org/1136/jech.2004.028092
6. Basten C, von Ehrlich M, Lassmann A. Income Taxes, Sorting and the Costs of Housing: Evidence from Municipal Boundaries in Switzerland*. Econ J (Lond). 2017;127(601):653–87. https://doi.org/https://doi.org/1111/ecoj.12489
7. Bowen EA, Mitchell CG. Housing as a Social Determinant of Health: Exploring the Relationship between Rent Burden and Risk Behaviors for Single Room Occupancy Building Residents. Soc Work Public Health. 2016;31(5):387–97. https://doi.org/https://doi.org/1080/19371918.2015.1137518
8. Galobardes B, Shaw M, Lawlor DA, Lynch JW, Davey Smith G. Indicators of socioeconomic position (part 2). J Epidemiol Community Health. 2006 Feb;60(2):95–101. https://doi.org/https://doi.org/1136/jech.2004.028092
9. Jeong A, Eze IC, Vienneau D, de Hoogh K, Keidel D, Rothe T, et al. Residential greenness-related DNA methylation changes. Environ Int. 2022 Jan;158:106945. https://doi.org/https://doi.org/1016/j.envint.2021.106945
10. Matthes KL, Zuberbuehler CA, Rohrmann S, Hartmann C, Siegrist M, Burnier M, et al. Selling, buying and eating - a synthesis study on dietary patterns across language regions in Switzerland. Br Food J. 2022 Mar;124(5):1502–18. https://doi.org/https://doi.org/1108/BFJ-02-2021-0141
11. Mozun R, Kuehni CE, Pedersen ES, Goutaki M, Kurz JM, de Hoogh K, et al.; On Behalf Of The Luis Study Group. LuftiBus in the school (LUIS): a population-based study on respiratory health in schoolchildren. Swiss Med Wkly. 2021 Aug;151:w20544. https://doi.org/https://doi.org/4414/smw.2021.20544
12. Statistik B für. Bevölkerungsdaten im Zeitvergleich, 1950-2020 - 1950-2020 | Tabelle. Bundesamt für Statistik 2021. https://www.bfs.admin.ch/bfs/de/home/statistiken/kataloge-datenbanken/tabellen.assetdetail.18845585.html ().
13. ISCO - International Standard Classification of Occupations. n.d. https://www.ilo.org/public/english/bureau/stat/isco/isco08/index.htm ().
14. Tillmann R, Voorpostel M, Antal E, Kuhn U, Lebert F, Ryser VA, et al. The Swiss Household Panel Study: observing social change since 1999. Longit Life Course Stud. 2016;7(1):64–78. https://doi.org/https://doi.org/14301/llcs.v7i1.360
15. Tele Atlas Schweiz AG. Strassennetz und Adressdaten von Tele Atlas gehören in jedes Geo-lnformationssystem. Geomatik Schweiz 2003:294–5. https://doi.org/https://doi.org/https://doi.org/5169/seals-236024
16. OECD. Compare your income - Methodology and conceptual issues. Paris: 2020.
17. Lipps O. Income imputation in the Swiss Household Panel 1999-2007. Lausanne: FORS; 2010.
18. Bopp M, Spoerri A, Zwahlen M, Gutzwiller F, Paccaud F, Braun-Fahrländer C, et al. Cohort Profile: the Swiss National Cohort—a longitudinal study of 6.8 million people. Int J Epidemiol. 2009 Apr;38(2):379–84. https://doi.org/https://doi.org/1093/ije/dyn042
19. Spoerri A, Zwahlen M, Egger M, Bopp M, Spoerri A, Zwahlen M, et al. The Swiss National Cohort: a unique database for national and international researchers. Int J Public Health. 2010 Aug;55(4):239–42. https://doi.org/https://doi.org/1007/s00038-010-0160-5
20. Office FS. Swiss National Cohort (SNC) n.d. https://www.bfs.admin.ch/bfs/en/home/statistiken/bevoelkerung/erhebungen/snc.html.
21. Stensrud MJ, Hernán MA. Why Test for Proportional Hazards? JAMA. 2020 Apr;323(14):1401–2. https://doi.org/https://doi.org/1001/jama.2020.1267
22. ISKO. Stata module to recode 4 digit ISCO-88 occupational codes n.d. https://ideas.repec.org/c/boc/bocode/s425802.html.
23. Wickham H, Averick M, Bryan J, Chang W, McGowan LD, François R, et al. Welcome to the Tidyverse. J Open Source Softw. 2019;4(43):1686. https://doi.org/https://doi.org/21105/joss.01686
24. Pebesma E. Simple Features for R: Standardized Support for Spatial Vector Data. R J. 2018;10(1):439. https://doi.org/https://doi.org/32614/RJ-2018-009
25. Valente P. Innovative Approaches to Census-Taking: Overview of the 2011 Census Round in Europe. In: Crescenzi F, Mignani S, editors. Statistical Methods and Applications from a Historical Perspective: Selected Issues. Cham: Springer International Publishing; 2014. pp. 187–200. https://doi.org/https://doi.org/1007/978-3-319-05552-7_17
26. Darin-Mattsson A, Fors S, Kåreholt I. Different indicators of socioeconomic status and their relative importance as determinants of health in old age. Int J Equity Health. 2017 Sep;16(1):173. https://doi.org/https://doi.org/1186/s12939-017-0670-3
27. Spycher J, Morisod K, Eggli Y, Moschetti K, Le Pogam MA, Peytremann-Bridevaux I, et al. Indicators on Healthcare Equity in Switzerland. New Evidence and Challenges. Report commissioned by the Federal Office of Public Health. Bern: FOPH; 2021.
28. Vallarta-Robledo JR, Marques-Vidal P, Sandoval JL, De Ridder D, Schaffner E, Humair JP, et al. The neighborhood environment and its association with the spatio-temporal footprint of tobacco consumption and changes in smoking-related behaviors in a Swiss urban area. Health Place. 2022 Jul;76:102845. https://doi.org/https://doi.org/1016/j.healthplace.2022.102845
29. Mongin D, Cullati S, Kelly-Irving M, Rosselet M, Regard S, Courvoisier DS; Covid-SMC Study Group. Neighbourhood socio-economic vulnerability and access to COVID-19 healthcare during the first two waves of the pandemic in Geneva, Switzerland: A gender perspective. EClinicalMedicine. 2022 Mar;46:101352. https://doi.org/https://doi.org/1016/j.eclinm.2022.101352
30. Riou J, Panczak R, Althaus CL, Junker C, Perisa D, Schneider K, et al. Socioeconomic position and the COVID-19 care cascade from testing to mortality in Switzerland: a population-based analysis. Lancet Public Health. 2021 Sep;6(9):e683–91. https://doi.org/https://doi.org/1016/S2468-2667(21)00160-2
31. Growth for Knowledge. GfK releases 2019 purchasing power for Austria and Switzerland n.d. https://www.gfk.com/insights/gfk-releases-2019-purchasing-power-for-austria-and-switzerland.
32. Lansley G. Cars and socio-economics: understanding neighbourhood variations in car characteristics from administrative data. Reg Stud Reg Sci. 2016;3(1):264–85. https://doi.org/https://doi.org/1080/21681376.2016.1177466
33. Blumenstock J, Cadamuro G, On R. Predicting poverty and wealth from mobile phone metadata. Science. 2015 Nov;350(6264):1073–6. https://doi.org/https://doi.org/1126/science.aac4420
34. Quercia D, Saez D. Mining Urban Deprivation from Foursquare: Implicit Crowdsourcing of City Land Use. IEEE Pervasive Comput. 2014;13(2):30–6. https://doi.org/https://doi.org/1109/MPRV.2014.31
35. Kloog I, Koutrakis P, Coull BA, Lee HJ, Schwartz J. Assessing temporally and spatially resolved PM2.5 exposures for epidemiological studies using satellite aerosol optical depth measurements. Atmos Environ. 2011;45(35):6267–75. https://doi.org/https://doi.org/1016/j.atmosenv.2011.08.066
36. Ward AD, Trowland H, Bracewell P. The Dynamic Deprivation Index: measuring relative socio-economic deprivation in NZ on a monthly basis. Kotuitui. 2019;14(1):157–76. https://doi.org/https://doi.org/1080/1177083X.2019.1578807
37. Allik M, Leyland A, Travassos Ichihara MY, Dundas R. Creating small-area deprivation indices: a guide for stages and options. J Epidemiol Community Health. 2020 Jan;74(1):20–5. https://doi.org/https://doi.org/1136/jech-2019-213255